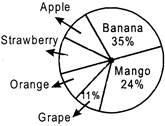
 How many apple flavoured milk shakes were sold daily if 600 milk shakes were sold in all?
A) \[30\]
B) \[60\]
C) \[45\]
D) \[10\]
Correct Answer: B
Solution :
Not Available


You need to login to perform this action.
You will be redirected in
3 sec

