| DIRECTION: The line graph shows the performance of two students during a year. Read the graph and answer the following questions. |
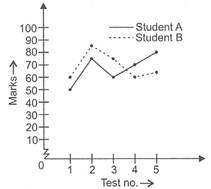 |
A) Student A
B) Both showed same performance
C) Student B
D) Can't be determined
Correct Answer: C
Solution :
Performance of student A during the year = Total marks of student A = 50 + 75 + 60 + 70 + 80 = 335 Performance of student B during the year = 60 + 85 + 75 + 60 + 65 = 345 \[\therefore \] Performance of student B is better during the year,


You need to login to perform this action.
You will be redirected in
3 sec

