-
question_answer1)
The curve drawn between velocity and frequency of photon in vacuum will be a [MP PET 2000]
A)
Straight line parallel to frequency axis done
clear
B)
Straight line parallel to velocity axis done
clear
C)
Straight line passing through origin and making an angle of 45o with frequency axis done
clear
D)
Hyperbola done
clear
View Solution play_arrow
-
question_answer2)
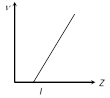
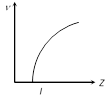
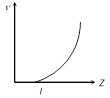
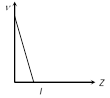
Which of the following figure represents the variation of particle momentum and the associated de-Broglie wavelength [AIIMS 1982]
A)
B)
C)
D)
View Solution play_arrow
-
question_answer3)
The figure shows the variation of photocurrent with anode potential for a photo-sensitive surface for three different radiations. Let \[{{I}_{a}},\ {{I}_{b}}\]and \[{{I}_{c}}\] be the intensities and \[{{f}_{a}},\ {{f}_{b}}\] and \[{{f}_{c}}\] be the frequencies for the curves a, b and c respectively [IIT-JEE (Screening) 2004]
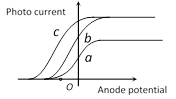
A)
\[{{f}_{a}}={{f}_{b}}\] and \[{{l}_{a}}\ne {{l}_{b}}\] done
clear
B)
\[{{f}_{a}}={{f}_{c}}\] and \[{{l}_{a}}={{l}_{c}}\] done
clear
C)
\[{{f}_{a}}={{f}_{b}}\] and \[{{l}_{a}}={{l}_{b}}\] done
clear
D)
\[{{f}_{a}}={{f}_{b}}\] and \[{{l}_{a}}={{l}_{b}}\] done
clear
View Solution play_arrow
-
question_answer4)
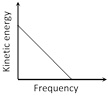
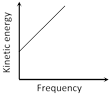
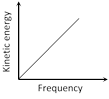
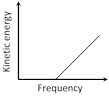
According to Einstein's photoelectric equation, the graph between the kinetic energy of photoelectrons ejected and the frequency of incident radiation is [MP PMT 1994; CBSE PMT 1996; CBSE PMT 2004]
A)
B)
C)
D)
View Solution play_arrow
-
question_answer5)
For the photoelectric effect, the maximum kinetic energy \[{{E}_{k}}\] of the emitted photoelectrons is plotted against the frequency n of the incident photons as shown in the figure. The slope of the curve gives [CPMT 1987; MP PET 2001; DPMT 2002]
A)
Charge of the electron done
clear
B)
Work function of the metal done
clear
C)
Planck's constant done
clear
D)
Ratio of the Planck?s constant to electronic charge done
clear
View Solution play_arrow
-
question_answer6)
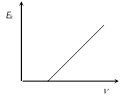
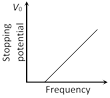
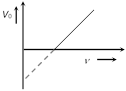
The stopping potential V for photoelectric emission from a metal surface is plotted along Y-axis and frequency n of incident light along X-axis. A straight line is obtained as shown. Planck's constant is given by [CPMT 1987; Similar to MP PMT 2000; Kerala PET 2001]
A)
Slope of the line done
clear
B)
Product of slope on the line and charge on the electron done
clear
C)
Product of intercept along Y-axis and mass of the electron done
clear
D)
Product of Slope and mass of electron done
clear
View Solution play_arrow
-
question_answer7)
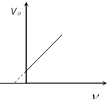
In an experiment on photoelectric effect the frequency f of the incident light is plotted against the stopping potential \[{{V}_{0}}\]. The work function of the photoelectric surface is given by (e is electronic charge) [CPMT 1987]
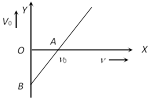
A)
OB \[\times \]e in eV done
clear
B)
OB in volt done
clear
C)
OA in eV done
clear
D)
The slope of the line AB done
clear
View Solution play_arrow
-
question_answer8)
The stopping potential as a function of the frequency of the incident radiation is plotted for two different photoelectric surfaces A and B. The graphs show that work function of A is [DPMT 1992]
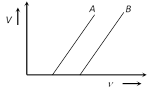
A)
Greater than that of B done
clear
B)
Smaller than that of B done
clear
C)
Equal to that of B done
clear
D)
No inference can be drawn about their work functions from the given graphs done
clear
View Solution play_arrow
-
question_answer9)
The intensity of X-rays from a Coolidge tube is plotted against wavelength as shown in the figure. The minimum wavelength found is \[{{\lambda }_{c}}\] and the wavelength of the \[{{K}_{\alpha }}\]line is \[{{\lambda }_{k}}\]. As the accelerating voltage is increased [IIT-JEE (Screening) 2001]
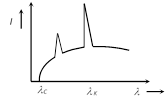
A)
\[({{\lambda }_{K}}-{{\lambda }_{C}})\]increases done
clear
B)
\[({{\lambda }_{K}}-{{\lambda }_{C}})\,\]decreases done
clear
C)
\[{{\lambda }_{K}}\] increases done
clear
D)
\[{{\lambda }_{K}}\] decreases done
clear
View Solution play_arrow
-
question_answer10)
The figure represents the observed intensity of X-rays emitted by an X-ray tube as a function of wavelength. The sharp peaks A and B denote [CBSE PMT 1995]
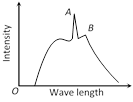
A)
Band spectrum done
clear
B)
Continuous spectrum done
clear
C)
Characteristic radiations done
clear
D)
White radiations done
clear
View Solution play_arrow
-
question_answer11)
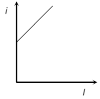
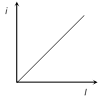
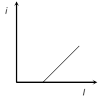
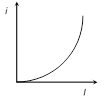
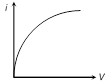
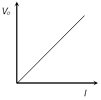
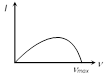
The graph between intensity of light falling on a metallic plate (I) with the current (i) generated is [DCE 2001]
A)
B)
C)
D)
View Solution play_arrow
-
question_answer12)
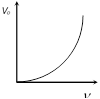
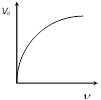
For a photoelectric cell the graph showing the variation of cut of voltage (Vo) with frequency (n) of incident light is best represented by [DCE 2001; MP PET 2003]
A)
B)
C)
D)
View Solution play_arrow
-
question_answer13)
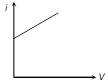
The curve between current (i) and potential difference (V) for a photo cell will be
A)
B)
C)
D)
View Solution play_arrow
-
question_answer14)
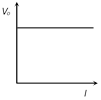
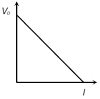
The correct curve between the stopping potential (V) and intensity of incident light (I) is
A)
B)
C)
D)
View Solution play_arrow
-
question_answer15)
The value of stopping potential in the following diagram
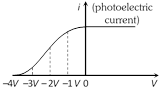
A)
? 4V done
clear
B)
? 3 V done
clear
C)
? 2V done
clear
D)
? 1 V done
clear
View Solution play_arrow
-
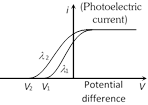
question_answer16)
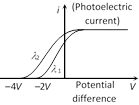
In the following diagram if V2 > V1 then
A)
\[{{\lambda }_{1}}=\sqrt{{{\lambda }_{2}}}\] done
clear
B)
\[{{\lambda }_{1}}<{{\lambda }_{2}}\] done
clear
C)
\[{{\lambda }_{1}}={{\lambda }_{2}}\] done
clear
D)
\[{{\lambda }_{1}}>{{\lambda }_{2}}\] done
clear
View Solution play_arrow
-
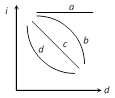
question_answer17)
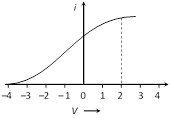
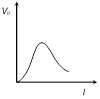
A point source of light is used in an experiment on photoelectric effect. Which of the following curves best represents the variation of photo current (i) with distance of the source from the emitter
A)
a done
clear
B)
b done
clear
C)
c done
clear
D)
d done
clear
View Solution play_arrow
-
question_answer18)
According to Einstein?s photoelectric equation, the plot of the kinetic energy of the emitted photo electrons from a metal versus the frequency, of the incident radiation gives a straight line whose slope [AIEEE 2004]
A)
Is the same for all metals and independent of the intensity of the radiation done
clear
B)
Depends on the intensity of the radiation done
clear
C)
Depends both on the intensity of the radiation and the metal used done
clear
D)
Depends on the nature of the metals used done
clear
View Solution play_arrow
-
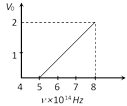
question_answer19)
The stopping potential \[({{V}_{0}})\] versus frequency (n) plot of a substance is shown in figure the threshold wave length is
A)
\[5\times {{10}^{14}}m\] done
clear
B)
6000Å done
clear
C)
5000 Å done
clear
D)
Cannot be estimated from given data done
clear
View Solution play_arrow
-
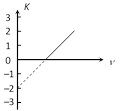
question_answer20)
Figure represents a graph of kinetic energy (K) of photoelectrons (in eV) and frequency (v) for a metal used as cathode in photoelectric experiment. The work function of metal is
A)
1 eV done
clear
B)
1.5 eV done
clear
C)
2 eV done
clear
D)
3 eV done
clear
View Solution play_arrow
-
question_answer21)
Figure represents the graph of photo current I versus applied voltage (V). The maximum energy of the emitted photoelectrons is
A)
2eV done
clear
B)
4 eV done
clear
C)
0 eV done
clear
D)
4 J done
clear
View Solution play_arrow
-
question_answer22)
The graph that correctly represents the relation of frequency n of a particular characteristic X-ray with the atomic number Z of the material is
A)
B)
C)
D)
View Solution play_arrow
-
question_answer23)
The intensity distribution of X-rays from two coolidge tubes operated on different voltages V1 and V2 and using different target materials of atomic numbers Z1 and Z2 is shown in the figure. Which one of the following inequalities is true?

A)
V1 > V2, Z1 < Z2 done
clear
B)
V1 > V2, Z1 > Z2 done
clear
C)
V1 < V2, Z1 > Z2 done
clear
D)
V1 = V2, Z1 < Z2 done
clear
View Solution play_arrow
-
question_answer24)
The correct graph between the maximum energy of a photoelectron and the inverse of wavelength of the incident radiation is given by the curve
A)
A done
clear
B)
B done
clear
C)
C done
clear
D)
None of the above done
clear
View Solution play_arrow
-
question_answer25)
The continuous x-ray spectrum obtained from a Coolidge tube is of the form
A)
B)
C)
D)
View Solution play_arrow
-
question_answer26)
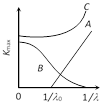
The dependence of the short wavelength limit \[{{\lambda }_{\min }}\] on the accelerating potential V is represented by the curve of figure
A)
A done
clear
B)
B done
clear
C)
C done
clear
D)
None of these done
clear
View Solution play_arrow
-
question_answer27)
The variation of wavelength \[\lambda \] of the \[{{K}_{\alpha }}\] line with atomic number Z of the target is shown by the following curve of
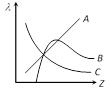
A)
A done
clear
B)
B done
clear
C)
C done
clear
D)
None of these done
clear
View Solution play_arrow
-
question_answer28)
In the graph given below. If the slope is \[4.12\times {{10}^{-15}}\]V-sec, then value of ?h? should be
A)
\[6.6\times {{10}^{-31}}\] J-sec done
clear
B)
\[6.6\times {{10}^{-34}}\]J-sec done
clear
C)
\[9.1\times 10-31\] J-sec done
clear
D)
None of these done
clear
View Solution play_arrow
-
question_answer29)
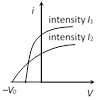
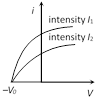
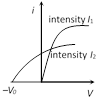
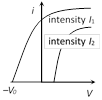
The curves (a), (b), (c) and (d) show the variation between the applied potential difference (V) and the photoelectric current (i), at two different intensities of light (I1 > I2). In which figure is the correct variation shown
A)
B)
C)
D)
View Solution play_arrow
-
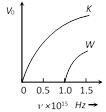
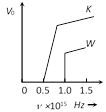
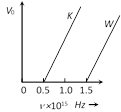
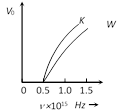
question_answer30)
The figure showing the correct relationship between the stopping potential V0 and the frequency n of light for potassium and tungsten is
A)
B)
C)
D)
View Solution play_arrow
-
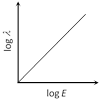
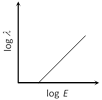
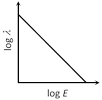
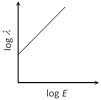
question_answer31)
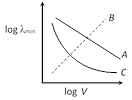
The log-log graph between the energy E of an electron and its de-Broglie wavelength \[\lambda \] will be
A)
B)
C)
D)
View Solution play_arrow
-
question_answer32)
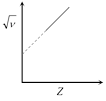
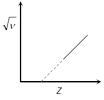
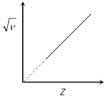
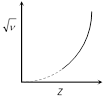
The graph between the square root of the frequency of a specific line of characteristic spectrum of X-rays and the atomic number of the target will be
A)
B)
C)
D)
View Solution play_arrow
-
question_answer33)
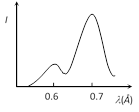
In the diagram a graph between the intensity of X-rays emitted by a molybdenum target and the wavelength is shown, when electrons of 30 keV are incident on the target. In the graph one peak is of \[{{K}_{\alpha }}\] line and the other peak is of \[{{K}_{\beta }}\] line
A)
First peak is of \[{{K}_{\alpha }}\] line at 0.6 Å done
clear
B)
Highest peak is of Ka line at 0.7 Å done
clear
C)
If the energy of incident particles is increased, then the peaks will shift towards left done
clear
D)
If the energy of incident particles is increased, then the peaks will shift towards right done
clear
View Solution play_arrow
-
question_answer34)
The maximum value of stopping potential in the following diagram is
A)
? 4V done
clear
B)
? 1V done
clear
C)
? 3V done
clear
D)
? 2V done
clear
View Solution play_arrow
-
question_answer35)
In a parabola spectrograph, the velocities of four positive ions P,Q,R and S are v1, v2, v3 and v4 respectively
A)
\[{{v}_{1}}>{{v}_{2}}>{{v}_{3}}>{{v}_{4}}\] done
clear
B)
\[{{v}_{1}}<{{v}_{2}}<{{v}_{3}}<{{v}_{4}}\] done
clear
C)
\[{{v}_{1}}={{v}_{2}}={{v}_{3}}={{v}_{4}}\] done
clear
D)
\[{{v}_{1}}<<{{v}_{2}}>{{v}_{3}}<{{v}_{4}}\] done
clear
View Solution play_arrow
-
question_answer36)
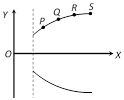
In Thomson spectrograph experiment, four positive ions P,Q,R and S are situated on Y-X curve a shown in the figure
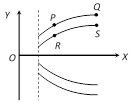
A)
The specific charge of R and S are same done
clear
B)
The masses of P and S are same done
clear
C)
The specific charges of Q and \[R\]are same done
clear
D)
The velocities of R and S are same done
clear
View Solution play_arrow
-
question_answer37)
The slope of frequency of incident light and stopping potential graph for a given surface will be [MP PET 1999; MP PMT 2000; JIPMER 2001, 02; UPSEAT 2003]
A)
h done
clear
B)
h/e done
clear
C)
eh done
clear
D)
e done
clear
View Solution play_arrow
-
question_answer38)
From the figure describing photoelectric effect we may infer correctly that [KCET 2005]
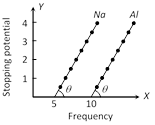
A)
Na and Al both have the same threshold frequency done
clear
B)
Maximum kinetic energy for both the metals depend linearly on the frequency done
clear
C)
The stopping potentials are different for Na and Al for the same change in frequency done
clear
D)
Al is a better photo sensitive material than Na done
clear
View Solution play_arrow
 done
clear
done
clear
 done
clear
done
clear
 done
clear
done
clear
 done
clear
done
clear
 done
clear
done
clear
 done
clear
done
clear
 done
clear
done
clear
 done
clear
done
clear
 done
clear
done
clear
 done
clear
done
clear
 done
clear
done
clear
 done
clear
done
clear
 done
clear
done
clear
 done
clear
done
clear
 done
clear
done
clear
 done
clear
done
clear
 done
clear
done
clear
 done
clear
done
clear
 done
clear
done
clear
 done
clear
done
clear
 done
clear
done
clear
 done
clear
done
clear
 done
clear
done
clear
 done
clear
done
clear
 done
clear
done
clear
 done
clear
done
clear
 done
clear
done
clear
 done
clear
done
clear
 done
clear
done
clear
 done
clear
done
clear
 done
clear
done
clear
 done
clear
done
clear
 done
clear
done
clear
 done
clear
done
clear
 done
clear
done
clear
 done
clear
done
clear
 done
clear
done
clear
 done
clear
done
clear
 done
clear
done
clear
 done
clear
done
clear
 done
clear
done
clear
 done
clear
done
clear
 done
clear
done
clear
 done
clear
done
clear
 done
clear
done
clear
 done
clear
done
clear
 done
clear
done
clear


