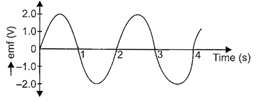
| Direction: Read the passage carefully and answer following question. A simple a.c. generator produces an alternating emf as shown in figure (i). |
 |
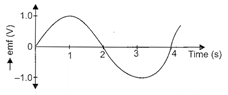
| If the speed of the generator is changed then the graph of the new output is shown in figure |
 |
A) In graph (i)
B) In graph (ii)
C) In both the graphs the frequency is same.
D) Data is insufficient.
Correct Answer: A
Solution :
In graph (i) time period, \[{{T}_{1}}=2\,s,\]so frequency, \[{{\upsilon }_{1}}=\frac{1}{{{T}_{1}}}=\frac{1}{2}Hz\] \[\Rightarrow \]\[{{\upsilon }_{1}}=0.5\,Hz\] In graph (ii), time period, \[{{T}_{2}}=4\,s\] Frequency, \[{{\upsilon }_{2}}=\frac{1}{{{T}_{2}}}=\frac{1}{4}Hz=0.25\,Hz\] \[\therefore \] \[{{\upsilon }_{1}}>{{\upsilon }_{2}}\]


You need to login to perform this action.
You will be redirected in
3 sec

