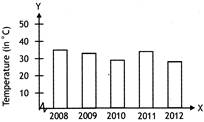
 Based on the information in the graph, which of the following statements is valid?
A) Temperature in Hyderabad decreased from 2008 to 2011.
B) It is likely that the average yearly temperature of Hyderabad during July to September will not rise beyond \[{{40}^{o}}C\].
C) It is likely that temperature in Hyderabad will not drop below \[{{30}^{o}}C\] in 2015.
D) The average yearly temperature in Hyderabad was lower in 2008 than in 2011.
Correct Answer: B
Solution :
Not Available


You need to login to perform this action.
You will be redirected in
3 sec

