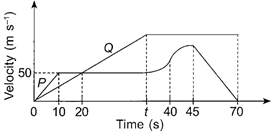
| (i) The velocity of car P is increasing at a decreasing rate from 40 s to 45 s in same direction. |
| (ii) Car Q is moving with a constant acceleration from 0 to 20 seconds. |
| (iii) Acceleration of the car Q is not zero at any point during whole journey. |
| (iv) After 20 s, P is behind Q. |
A) Only (i) and (ii)
B) Only (ii) and (iii)
C) Only (iii) and (iv)
D) Only (iv) and (i).
Correct Answer: A
Solution :
(i) From 40 s to 45 s, direction of car P is same but velocity is increasing at a decreasing rate of acceleration. (ii) Acceleration of car Q from 0 to 20 seconds is \[\frac{(50-0)}{(20-0)}=2.5m{{s}^{-2}}\]i.e., constant. (iii) Acceleration of the car Q is zero from t s to 70 s, so velocity is constant. (iv) Distance travelled by P at the end of first 20 s \[=\frac{1}{2}\times 50\times (10+20)=750m\] Distance travelled by Q at the end of first 20s \[=\frac{1}{2}\times 50\times 20=500m\] Difference in the distance travelled by P and Q = (750 - 500) m = 250 m After 20 s, Q is behind P by 250 m.


You need to login to perform this action.
You will be redirected in
3 sec

