| Explain the steps taken in derivation of consumption curve from saving curve. Use diagram. |
| Or |
| Explain the steps taken in the derivation of saving curve from the consumption curve. Use diagram. |
Answer:
Steps taken for derivation of consumption curve are: (i) At zero level of income, the saving is\[O\overline{S}\]which is the amount of autonomous consumption.So,\[O\overline{S}=O\overline{C}\]Hence, the consumption will start from the point\[\overline{C}\]. (ii) We draw a 45° line passing through the origin which shows that C = Y. This is the income line. (iii) Now we draw a vertical line from the point E, where saving is zero. At zero level of saving, C=Y,so B the break-event point. (iv) The consumption curve is derived meeting C and B and extending it forward.  Income (Y) Diagram Showing Derivation of Consumption Curve
Or
Steps taken for derivation of saving curve are:
Income (Y) Diagram Showing Derivation of Consumption Curve
Or
Steps taken for derivation of saving curve are:
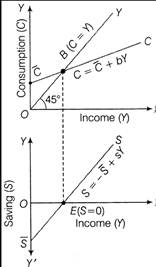 Diagram Showing Derivation of Saving Curve
(i) At zero level of income (Y), the autonomous consumption is\[O\overline{C}\]. If we take the vertical distance between the take consumption curve,\[C\overline{C}\]and income line at zero level of income, then.\[O\overline{S}=O\overline{C}\]Hence,the saving curve starts from point on the negative Y-axis.
(ii) The consumption curve intersects income line at point B. B is the break-even point where consumption is equal to income (C = Y). At this point, saving will be zero as all the income is consumed. Hence, the saving curve will intersect the X-axis (at point E) at this income level.
(iii) The consumption is less than income beyond point E. It means the excess income after consumption is saved and hence, the saving curve moves toward positive direction above X-axis with the increase in the level of income.
Diagram Showing Derivation of Saving Curve
(i) At zero level of income (Y), the autonomous consumption is\[O\overline{C}\]. If we take the vertical distance between the take consumption curve,\[C\overline{C}\]and income line at zero level of income, then.\[O\overline{S}=O\overline{C}\]Hence,the saving curve starts from point on the negative Y-axis.
(ii) The consumption curve intersects income line at point B. B is the break-even point where consumption is equal to income (C = Y). At this point, saving will be zero as all the income is consumed. Hence, the saving curve will intersect the X-axis (at point E) at this income level.
(iii) The consumption is less than income beyond point E. It means the excess income after consumption is saved and hence, the saving curve moves toward positive direction above X-axis with the increase in the level of income.


You need to login to perform this action.
You will be redirected in
3 sec

