Directions (Q. 1 - 5): Study the following pie-charts and table carefully to answer the questions given below: The pie-charts show the percentage of candidates who secured qualifying marks in SSC-CGL and IBPS PO in 2016 from different cities. 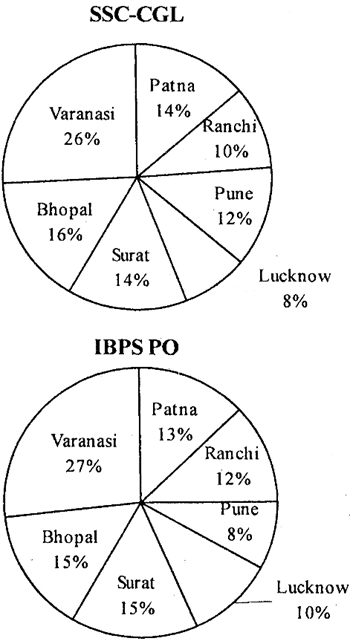 The following table shows the ratio of the number of male to female candidates who secured qualifying marks from different cities.
| City | SSC CGL | IBPS PO |
| Male : Female | Male : Female | |
| Patna | 3:2 | 4:5 |
| Ranchi | 1:3 | 4:7 |
| Pune | 2:3 | 7:9 |
| Lucknow | 5:7 | 2:2 |
| Surat | 9:7 | 3:7 |
| Bhopal | 4:3 | 6:1 |
| Varanasi | 3:5 | 1:5 |
A) 4000
B) 6015
C) 2800
D) 3000
E) 7000
Correct Answer: C
Solution :
Let the total number of candidates who secured qualifying marks in IBPS PO be\[x\]. 15 % of\[x\times \frac{6}{7}-15%\,\,\text{of}\,\,x\times \frac{3}{10}=234\] or,\[\frac{90x}{700}-\frac{45x}{1000}=234\] or\[\frac{900x-315x}{7000}=234\] or,\[585x=234\times 7000\] \[\therefore \]\[x=\frac{234\times 7000}{585}=2800\]


You need to login to perform this action.
You will be redirected in
3 sec

