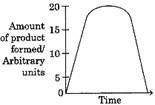
| The graph shows the amount of product formed by a standard concentration of enzyme and a standard concentration of substrate at a temperature of \[20{}^\circ C.\] |
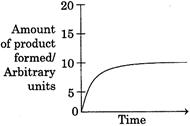 |
| Which graph shows the effect on the activity of the enzyme of decreasing the temperature to \[15{}^\circ C?\] |
A)
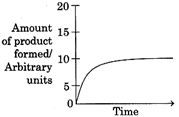
B)
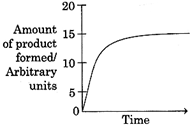
C)
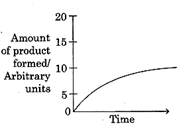
D)
Correct Answer: C
Solution :
The rate of reaction can be determined from the gradient of the graph, the faster the rate of reaction, the steeper the gradient while the slower the rate of reaction the more gentle the gradient. Decreasing the temperature decreases the rate of enzyme controlled reaction, resulting in a graph with a more gradual gradient with 10 arbitrary units of product formed.


You need to login to perform this action.
You will be redirected in
3 sec

