| The variation of concentration of the product P with time in the reaction, \[A\to P\] is shown in following graph. |
 |
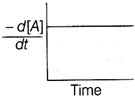
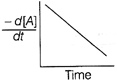
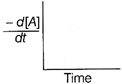
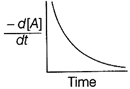
| The graph between \[\frac{-\,d[A]}{dt}\]and time will be of the at type |
A)
B)
C)
D)
Correct Answer: A
Solution :
| As from the given graph, it is clear that the concentration of the product increases linearly with time (, thus order of the reaction |
| \[=0\,and-\frac{d\left[ A \right]}{dt}=cons\tan t\] |
| Thus correct plot is given option [a]. |


You need to login to perform this action.
You will be redirected in
3 sec

