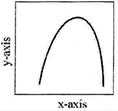
| The curve given below shows enzymatic activity with relation to three conditions (pH, temperature and substrate concentration). What do the two axis (x and y) represent? |
 |
A)
x-axis y-axis Enzymatic activity pH
B)
x-axis y-axis Temperature Enzymatic activity
C)
x-axis y-axis Substrate concentration Enzymatic activity
D)
x-axis y-axis Enzymatic activity Temperature
Correct Answer: B
Solution :
The relation between temperature and enzyme activity is shown in the given curve.


You need to login to perform this action.
You will be redirected in
3 sec

