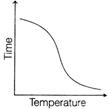
A)

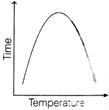
B)
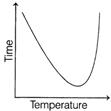
C)
D)
Correct Answer: C
Solution :
Since, the y-axis is time, the graph obtained would be a vertically inverted reaction rate us temperature graph. As the temperature increases, the time needed decreases at first until a minimum because an increased number of molecules have sufficient energy to pass over the energy barrier and react to form products. A further increase in temperature results in a more rapid increase of time required because of temperature induced denaturation of the enzyme.


You need to login to perform this action.
You will be redirected in
3 sec

