| The following bar graph represents the data for different sizes of shoes worn by the students in a school. Read the graph and answer the following questions. |
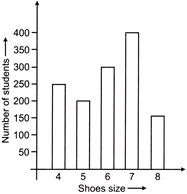 |
| (a) Find the number of students whose shoe sizes have been collected. |
| (b) What is the number of students wearing shoe size 6? |
| (c) What are the different sizes of the shoes worn by the students? |
| (d) Which shoe size is worn by the maximum number of students? |
| (e) Which shoe size is worn by minimum number of students? |
| (f) State whether true of false: |
| The total number of students wearing shoe sizes 5 and 8 is the same as the number of students wearing shoe size 6 |
Answer:
(a) The number of students whose shoe size have been collected \[=250+200+300+400+150=1300\] (b) The number of students wearing shoe size \[6=300\]. (c) The different sizes of the shoes wearing by the students are: 4, 5, 6, 7 & 8. (d) The maximum number of students wearing shoe size is 7. (e) The minimum number of students wearing shoe size is 8. (f) The given statement is false.


You need to login to perform this action.
You will be redirected in
3 sec

