| (a) Draw the graph of the function y = 3x + 1. |
| (b) The given graph represents the total runs scored by two batsmen A and B, during each of the ten different matches in the year 2014. |
 |
| Study the graph and answer the following questions: |
| (a) What information is given on the two axes? |
| (b) Which line shows the runs scored by batsman A? |
Answer:
(a) Let y = 3x +1 ....(1) Putting x = 0,1,2, in equation (i) at x = 0 then \[y=3\times 0+1=1\] at x = 1 then \[y=3\times 1+1=3+1=4\] ata x = 2 then \[y=3\times 2+1=6+1=7\] Thus
X 0 1 2 Y 1 4 7 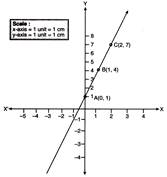
(b) (i) The horizontal axis (or the x-axis) indicates the matches played during the year 2014. The vertical axis (or the y-axis) shows the total runs scored in each match. (ii) The dotted line shows the runs scored by Batsman A. (This is already indicated at the top of the graph).


You need to login to perform this action.
You will be redirected in
3 sec

