| City | Mumbai | Kolkata | Delhi | Chennai |
| Population | 120 | 130 | 150 | 80 |
Answer:
To construct the bar graph representing the given data, we follow the following steps. (a) We take a graph paper and draw two mutually perpendicular lines OX and OY. (b) Along the horizontal line OX, we mark 'cities' and along the vertical line, we mark the 'population'. (c) Along the axis OX, we choose equal suitable width of each bar. The gap between the bars is chosen same. (d) Choose a suitable scale to determine the heights of the bars, according to the availability of space. Here, we choose 1 big division to represent 20 lakh population. (e) Calculate the height of various bars as follows: The height of the bar Mumbai = \[\frac{120}{20}\] = 6 big divisions The height of the bar for Kolkata = \[\frac{130}{20}\] = 6.5 big divisions The height of the bar for Delhi =\[\frac{150}{20}\] = 7.5 big divisions The height of the bar for Chennai =\[\frac{80}{20}\] = 4 big divisions (f) Now, we draw the bars as shown in Fig. below and at the top of each bar we write the population of the corresponding city. 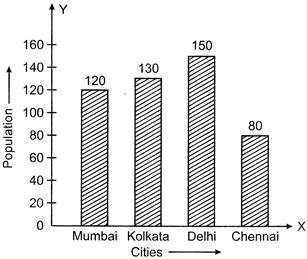


You need to login to perform this action.
You will be redirected in
3 sec

