A) Sigmoid
B) Hyperbolic
C) Linear
D) Parabolic
Correct Answer: A
Solution :
In the relationship between the percentage saturation of haemoglobin (by volume) in the blood and the oxygen tension (in partial tension) \[P{{O}_{2}}\]of the blood. It is usually a sigmoid plot. Haemoglobin molecules can bind up to four oxygen molecules in a reversible way. The shape of the curve results with incoming molecules. The binding of the first molecule is difficult. However, this facilitates the binding of the second and third molecules and it is only when the fourth molecule is to be bound that the difficulty increases, partly as a result of crowding of the haemoglobin molecule, partly as a natural tendency of oxygen to dissociate.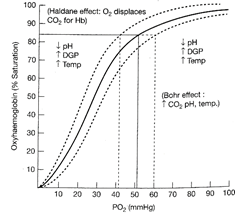 The\[{{O}_{2}}-\]Hb dissociation curve is a sigmoidal curve that represents the relationship between\[{{O}_{2}}\]concentration and the percentage saturation of Hb As the concentration increases from about 90 per cent there is a significant plateau in the curve, which has several important biological repercussions. Hence, the correct option is (a).


You need to login to perform this action.
You will be redirected in
3 sec

