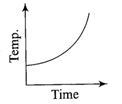
A)
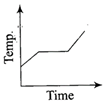
B)
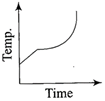
C)
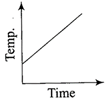
D)
Correct Answer: B
Solution :
Initially liquid oxygen will gain the temperature up to its boiling temperature, then it changes its state of gas. After this again its temperature will increase, so corresponding graph will be option .


You need to login to perform this action.
You will be redirected in
3 sec

