A)

B)

C)

D)

Correct Answer: A
Solution :
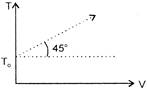
From the diagram, \[T=V\,\tan {{45}^{o}}+{{T}_{0}}\] \[\Rightarrow \] \[T=V+{{T}_{0}}\] For one mole of an ideal gas \[T=\frac{PV}{R}\] Now put it in equation (i), we get \[\frac{PV}{R}=V+{{T}_{0}}\] \[(P-R)\,\upsilon =R{{T}_{0}}\] Hence, graph is rectangular hyperbola.


You need to login to perform this action.
You will be redirected in
3 sec

