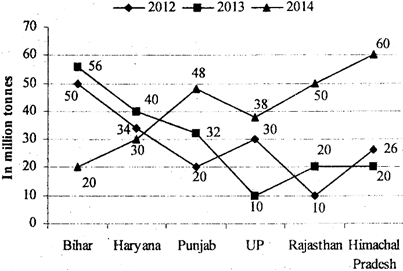
Directions (Q. 56-60): Study the following graph carefully and answer the questions accordingly. The following graph shows the production of wheat (in million tonnes) in six states for the period 2012 to 2014.
A) 53.25%
B) 46.42%
C) 47.32%
D) 61.25%
E) 64.27%
Correct Answer: B
Solution :
Required\[%=\frac{56-30}{56}\times 100=46.42%\]


You need to login to perform this action.
You will be redirected in
3 sec

