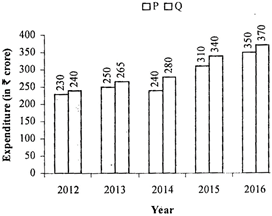
| Direction: Study the following bar graph and line graph carefully and answer the questions given below: The following bar graph shows the expenditure (in Rs. cr) of company P and Q. \[\text{ }\!\!%\!\!\text{ profit=}\frac{\text{income-Expenditure}}{\text{Expenditure}}\text{ }\!\!\times\!\!\text{ 100}\] |
 |
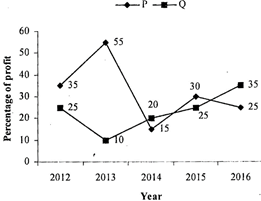
| The line-graph shows the percentage profit of two companies over the years. |
 |
A) 27:25
B) 29:33
C) 27:31
D) 31:34
E) 34:37
Correct Answer: D
Solution :
Reqd ratio\[=\left( 250\times \frac{155}{100} \right):\left( 340\times \frac{125}{100} \right)\] \[=155:170=31:34\]


You need to login to perform this action.
You will be redirected in
3 sec

