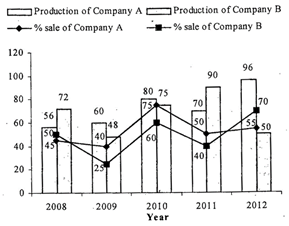
| Direction: The following bar graph shows the production of cycle (in thousand) by two companies A and B over the period 2008-2012 and the tine-graph shows the percentage sale of these companies. |
 |
A) 2008
B) 2009
C) 2010
D) 2011
E) 2012
Correct Answer: C
Solution :
\[2009\to \frac{2400}{72}=33%\]fall \[2010\to \frac{2700}{48}=56.25%\]rise% \[2011\to \frac{1500}{75}=20%\]rise% \[2012\to \frac{4000}{90}=44.44%\]fall


You need to login to perform this action.
You will be redirected in
3 sec

