| Direction: Study the following graph carefully and answer the question given below. |
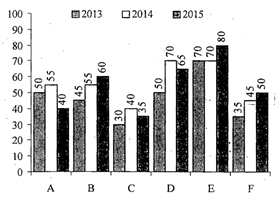
| Production of Aluminium by different companies in three consecutive years (in thousand tonnes) |
 |
A) 9000 tonnes
B) 9167 tonnes
C) 10002 tonnes
D) 9435 tonnes
E) 9020 tonnes
Correct Answer: B
Solution :
; Required difference \[=\frac{335-280}{6}\times 1000\] = 9166.67 tonnes \[\approx \]9167 tonnes


You need to login to perform this action.
You will be redirected in
3 sec

