Banking Sample Paper SBI PO (Main) Sample Test Paper-2

  • question_answer
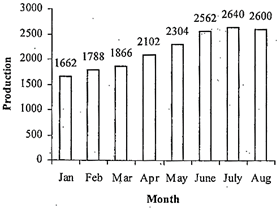
    Direction: Study the following graph and answer the questions given below it.
    Approximately by v/hat per cent did the total production in the two consecutive months of July and August increase over the total production in the first two consecutive months of January and February?

    A)  52%.                           

    B)  66%       

    C)  69%                            

    D)  59%                            

    E)  65%

    Correct Answer: A

    Solution :

     Reqd % increase \[=\frac{5240-3450}{3450}\times 100=\frac{1750}{3450}\times 100=52%\]


You need to login to perform this action.
You will be redirected in 3 sec spinner