| Direction: Study the radar graph carefully and answer the questions that follow: |
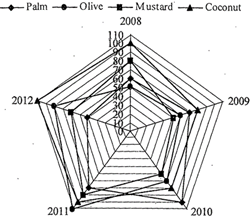
| The graph show price (in per kg) of various types of oils in different years |
 |
A) 2009
B) 2008
C) 2010
D) 2012
E) 2011
Correct Answer: A
Solution :
The average price of oil in 2008 \[=\frac{1}{4}\times (50+60+80+100)=\]72.5 per kg Similarly, in \[2009=\frac{1}{4}\times (50+60+70+80)=\]Rs.65 per kg In \[2010=\frac{1}{4}\times (60+70+80+100)=\]Rs.77.5 per kg In \[2011=\frac{1}{4}\times (80+90+100+110)=\]Rs.95 per kg In \[2012=\frac{1}{4}\times (50+70+90+110)=\]Rs.80 per kg In 2009 the average price of all types of oils is the minimum.


You need to login to perform this action.
You will be redirected in
3 sec

