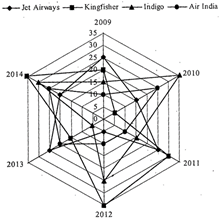
| Direction: Study the radar graph carefully and answer the questions that follow: |
| The graph shows the income of various aviation companies (in Rs. crore) in different years. |
| Number of passengers \[=\frac{\text{Income}}{\text{Fare}\,\text{per}\,\text{passenger}}\] |
 |
A) 2014
B) 2013
C) 2012
D) 2011
E) 2010
Correct Answer: A
Solution :
Total income of aviation companies in the year \[2009=10+15+20+25=\]Rs.70 crore Similarly in\[2010=5+15+25+35=\]Rs.80 crore In \[2011=10+15+25+30=\]Rs.80 crore In\[2012=5+10+25+35=\]Rs.75 crore In\[2013=5+15+20+25=\]Rs.65 crore In\[2014=20+25+30+35=\]Rs. 10 crore In 2014 the income of all aviation companies is the maximum.


You need to login to perform this action.
You will be redirected in
3 sec

