| S. No. | Time (minutes) | Distance (km) |
| (i) | 0 | 0 |
| (ii) | 5 | 6.6 |
| (iii) | 15 | 20 |
| (iv) | 30 | 40 |
| (v) | 45 | 60 |
| (vi) | 60 | 80 |
Answer:
The following steps may be followed: (i) Draw two perpendicular lines to represent the two axes and mark them OX and OY. O is the intersection of the two axes. (ii) Decide the quantity to be shown along the x-axis and that to be shown along the y-axis. From the given data, we are measuring distance at given intervals of time. So time is to be shown along x ? axis and distance along y ? axis. (iii) Choose a scale to represent the given data. Suppose we have 4 squares (or 40 divisions) along x ? axis and 4 squares (or 40 divisions) along y ? axis. Along x-axis we can take 10 divisions equal to 15 min and along y ? axis we can take 10 divisions equal to 20 km. (iv) Mark the values of time and distance on the respective axes. (v) Now mark points on the graph paper to represent each set of values for distance and time. (vi) Join all points on the graph. Graph obtained is shown below: 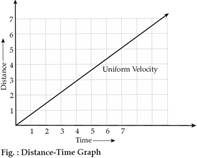


You need to login to perform this action.
You will be redirected in
3 sec

