| Study the table given below and answer the questions that follow: | |||
| Continent-wise Distribution of Million Cities | |||
| Continent | Early 1950 | Mid 1970s | Mid 2000 |
| Europe | 23 | 30 | 58 |
| Asia | 32 | 69 | 206 |
| North and | |||
| Central America | 16 | 36 | 79 |
| South America | 8 | 17 | 43 |
| Africa | 3 | 8 | 46 |
| Australia | 2 | 2 | 6 |
| World Total | 84 | 162 | 438 |
| Source: www.citypopulation.deworld.btml | |||
| (i) Name the two continents which have shown the highest growth rate of million cities from 1950 to 2000. | |||
| (ii) What could have been the reason for such a growth of million cities? | |||
| (iii) Give the meaning of a 'million city'. | |||
| Study the diagram given below and answer the questions that follow: |
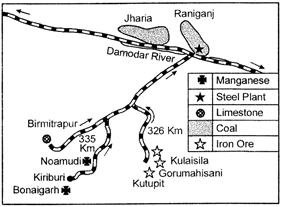 |
| (i) Identify and name the steel plant shown in the diagram. |
| (ii) Name the mining areas which supply coal and manganese to this plant. |
| (iii) Which is the source of water supply to this plant? |
| Identify the five Geographical features shown on the political outline map of the World as A, B, C, D and E and write their correct names on the lines marked near them with the help of following information: |
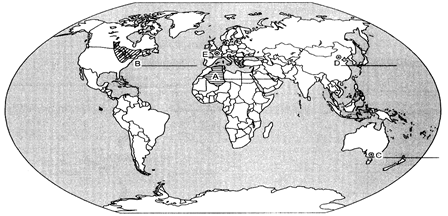 |
| (A) The Country with largest area in Africa |
| (B) An area of dairy farming |
| (C) A major sea port |
| (D) An international airport |
| (E) A mega city |
| Locate and label the following features with appropriate symbols on the given outline political map (on page 15) of India: |
| (I) The state with lowest density of population. |
| (II) The state with highest percentage of rural population. |
| (III) A major copper mining area in Southern Rajasthan. |
| (IV)The integrated iron and steel plant located in Chhattisgarh. |
| (V) The international airport located in Assam. |


You need to login to perform this action.
You will be redirected in
3 sec

