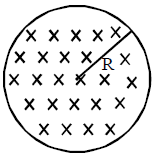
 In that case, which of the following graphs, drawn schematically, correctly shows the variation of the induced electric fieldE(r)?
JEE Main Online Paper (Held On 19 April 2016)
In that case, which of the following graphs, drawn schematically, correctly shows the variation of the induced electric fieldE(r)?
JEE Main Online Paper (Held On 19 April 2016)
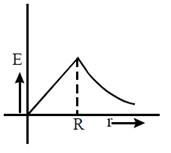
A)
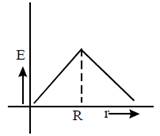
B)
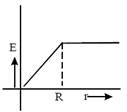
C)
D)
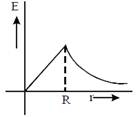
Correct Answer: A
Solution :
Inside the sphere field varies linearly i.e., \[E\propto r\] with distance and outside varies according to \[E\propto \frac{1}{{{r}^{2}}}\] Hence the variation is shown by curve (a)


You need to login to perform this action.
You will be redirected in
3 sec

