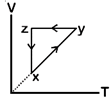
 The P-V diagram that best describes this cycle is: (Diagrams are schematic and not to scale) [JEE MAIN Held On 08-01-2020 Morning]
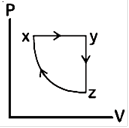
A)
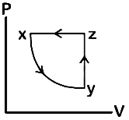
B)
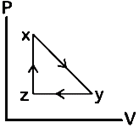
C)
D)
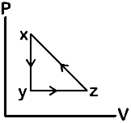
Correct Answer: A
Solution :
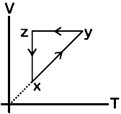 From the corresponding V-T graph Process \[xy\to \]Isobaric expansion, Process \[yz\to \]Isochoric (Pressure decreases) Process \[zx\to \]Isothermal compression Therefore, corresponding PV graph is
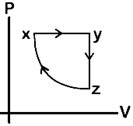


You need to login to perform this action.
You will be redirected in
3 sec

