| Figure shows a circular area of radius R where a uniform magnetic field \[\vec{B}\]is going into the plane of paper and increasing in magnitude at a constant rate. |
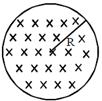 |
| In that case, which of the following graphs, drawn schematically, correctly shows the variation of the induced electric field E(r)? [JEE ONLINE 19-04-2014] |
A)

B)

C)

D) None of these
Correct Answer: D
Solution :
Inside the sphere field varies linearly i.e., \[E\propto r\] with distance and outside varies according to \[E\propto \frac{1}{{{r}^{2}}}\] Hence the variation is shown by curve [a]


You need to login to perform this action.
You will be redirected in
3 sec

