| Explain national income equilibrium through aggregate demand and aggregate supply. Use diagram. Also explain the changes that take place in an economy when the economy is not in equilibrium. |
| Or |
| Outline the steps required to be taken in deriving saving curve from the given consumption curve. Use diagram. |
Answer:
Aggregate Demand and Aggregate Supply approach (AD and AS approach). Under this approach, the equilibrium level of income is determined at the point where Aggregate Demand (AD) is equal to Aggregate Supply (AS). 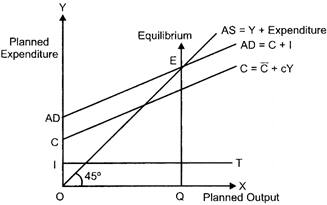
In this diagram, consumption curve is depicted by C and the investment curve is depicted by the horizontal straight line parallel to the output/income axis. Summing-up the investment curve and consumption curve, we get the Aggregate Demand curve represented by AD = C + I. The Aggregate Supply curve is represented by the 45° line. Throughout this line, the planned expenditure is equal to the planned output. The point E is the equilibrium point, where the planned level of expenditure (AD) is equal to the planned level of output (AS). Accordingly, the equilibrium level of output (income) is OQ. In case, if AD > AS, then it implies a situation, where the total demand for goods and services is more than the total supply of the goods and services. This implies a situation of excess demand. Due to the excess demand, the producers draw down their inventory and increases production. The increase in production requires hiring more factors of production, thereby increases employment level and income. Finally, the income will rise sufficiently to equate the AD with AS, thus the equilibrium is restored back. On the other hand, in case, AS > AD, then. it implies a situation, where the total supply of goods and services Is more than the total demand for the goods and service. This implies a situation of deficit demand. Due to the deficit demand, the producers experience pilling-up of stock of unsold goods, i.e., inventory accumulation. This would force the producers to cut-back the production, thereby results in the reduced employment of factors of production. This leads to fall in the income and output. Finally, the income and output will fall sufficiently to equate the AD with AS, thus the equilibrium is restored back. Or In the diagram, is the consumption curve. The \[{{45}^{o}}\] line is the aggregate supply curve. At point A, consumption = income i.e., (Y = C) represents the autonomous consumption i.e., consumption at zero level of income. Steps for derivation of supply curve from consumption curve as follows: (i) Corresponding to in the consumption function we have - in the saving function. That is, there are negative savings equal to autonomous consumption at Y = 0. This is represented by S on the negative axis in the lower panel. (ii) At point A (Y = C). This implies that all the income is spent on consumption expenditure. Thus savings equal to zero. This is shown as S = 0 in lower panel. This point is also known as the Break-even point. (iii) Beyond the break-even point, by connecting points S and B we derive the straight upward sloping saving curve. (iv) SS is the required saving curve. 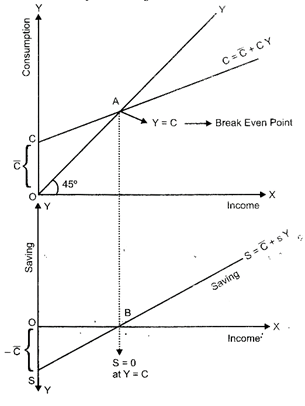


You need to login to perform this action.
You will be redirected in
3 sec

