| When is an economy in equilibrium? Explain with the help of saving and Investment functions. Also explain the changes that take place in an economy when the economy is not in equilibrium. Use diagram. |
| Or |
| Outline the steps required to be taken in deriving the Consumption Curve from the given Saving Curve. Use diagram. |
| Note: The following question is for the Blind Candidates only in lieu of Q.No.32. |
| Define investment. Explain national income equilibrium through saving and investment function. Also explain the changes that takes place in an economy when the economy is not in equilibrium. |
| Or |
| What is Consumption Function? How can it be derived from the Saving Function? Explain. |
Answer:
An economy is in equilibrium when either of the two conditions are satisfied. 1. Aggregate Demand = Aggregate Supply 2. Saving = Investment (Saving and Investment Approach) According to this approach, the equilibrium is determined at that point, where the saving and investment are equal to each other. In other words, the equilibrium is established, where leakages are equal to the injections. 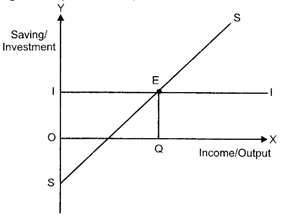
In the diagram, SS represents the saving curve and II represents the investment curve. The investment curve is a horizontal line as it represents the autonomous investment. At point E, Savings = Investment, thus point E represents the equilibrium point, where the saving curve SS and the investment curve II intersects. Accordingly, OQ is the equilibrium level of income (output). To the left of point E, saving is less than investment. When I exceeds S i.e., when injections into the circular flow of income is greater than withdrawal from the income, implies that available supply of goods and services is less than what is required to meet the current demand for goods and services. In other words, we can understand this as low saving implies high consumption, which means that the output demand (due to high consumption) is greater than the planned output. Thus, there exists a portion of demand that remains unsatisfied, thereby, leading to an unplanned decline in the inventory. Thus to prevent inventories from falling, savings in the economy must be increase. This will happen till savings are again equal to investment and the equilibrium is restored. To the right of point E, savings is greater than investment. When S exceeds I i.e., when withdrawal from the income is greater than injections into the circular flow of income, implies that total consumption expenditure is less than what is required to purchase the available supply of goods and services. In other words, we can understand this as high saving implies low consumption, which means that the output so M (due to low consumption) is less than the planned output Thus, there exists a portion of produced output that remained unsold, thereby, Leading to accumulation of unplanned inventory. Thus to prevent accumulation of inventories, savings in the economy will be reduced. Tills will happen till savings are again equal to investment and the equilibrium is restored. Or Derivation of Consumption Curve from Saving Curve 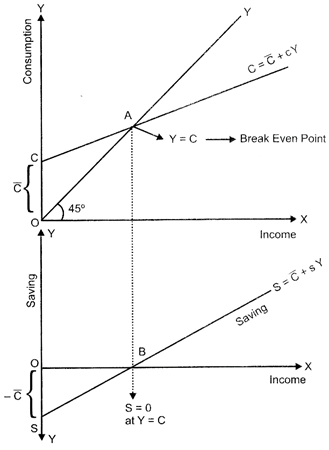
In the lower part of the diagram, \[-\,\overline{C}+sY\] is the saving curve, OS equal to \[-\,\overline{C}\] represents the saving at zero level of income. Steps for the derivation of consumption curve from the saving curve are as follows: (i) Corresponding to \[-\,\overline{C}\]: in the saving function, we have \[\,\overline{C}\] in the consumption function. That is, it represents the autonomous consumption or the consumption at zero level of income. The autonomous consumption is financed by drawing down savings. (ii) At point B, saving equals zero. This suggests that whole of income is spent on consumption. That is, Y = C. This point is also known as the break-even point. This is shown by point A in the upper panel denoting \[Y=C\]. (iii) By joining the points C and A we derive the straight upward sloping consumption curve. (iv) CC is the required consumptions curve.


You need to login to perform this action.
You will be redirected in
3 sec

