Answer:
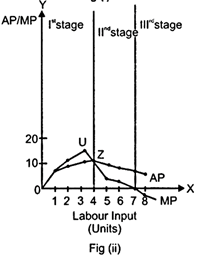
The different phases of changes in Total Product (TP) and Marginal Product (MP) can be understood with the help of Law of Variable Proportions. As per this law, if more and more of variable factor (labour) is combined with the same quantity of fixed factor (capital), then initially the total product will increase but gradually after a point, the total product will become smaller and smaller. The following are the three phases (stages) of the Changes in the two variables. Ist Stage: Increasing returns to a factor This stage starts from the origin point 0 and continues till the point of inflexion (K) on the TP curve. During this phase, TP increases at an increasing rate and is also accompanied by rising MP curve (in figure ii). The MP curve attains its maximum point (U) corresponding to the point of inflexion. Throughout this stage, AP continues to rise. IInd Stage: Diminishing returns to a factor This stage starts from point K and continues till point B on the TP curve. During this stage, the TP increases but at a decreasing rate and attains its maximum point at B, where it remains constant. On the other hand (in the figure (ii), the MP curve continues to fall and cuts AP from its maximum point Z, where MP equals AP. When TP attains its maximum point, corresponding to it, MP becomes zero. AP, in this stage initially rises, attains its maximum point at Z and thereafter starts falling. IIIrd Stage: Negative Returns to a Factor This stage begins from the point B on the TP curve. Throughout this point, TP curve is falling and MP curve is negative. Simultaneously, the AP curve continues to fall and approaches the x-axis (but does not touch it). Like the first stage, this stage is also known as non-economic zone as any rational producer would not operate in this zone. This is because the addition to the total output by the additional labour unit (i.e. marginal product) is negative. This implies that employing more labour would not contribute anything to the total product but will add to cost of the production in form of additional wage. Hence, the cost of the additional labour input is greater the benefit of employing it. The law of variable proportion can be easily understood with the help of following schedule and diagram. Units of Capital Units of Labour TP AP MP 1 0 0 0 - 1 1 7 7 7 1 2 18 9 11 1 3 33 11 15 1 4 44 11 11 1 5 48 9.6 4 1 6 51 8.5 3 1 7 51 7.4 0 1 8 49 6.1 -2 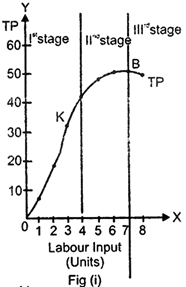


You need to login to perform this action.
You will be redirected in
3 sec

