(I) 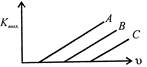 |
(II)  |
(III)  |
(IV)  |
A) I
B) II
C) III
D) IV
Correct Answer: A
Solution :
: For photoelectric effect, \[h\upsilon =\phi +\]kinetic energy of electron emitted \[h\upsilon ={{K}_{\max }}\]for maximum kinetic energy or \[\frac{{{K}_{\max }}}{\upsilon }=h=\]slope of the graph. = it is a constant. Frequency\[\upsilon \]of incident light is positive. Hence figure\[(I)\]represents the graph.


You need to login to perform this action.
You will be redirected in
3 sec

