Answer:
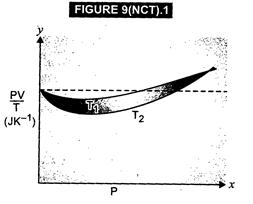
(a) The dotted plot shows that![]()
![]() is a
constant quantity, independent of pressure P. This signifies the ideal gas
behaviour.
(b)
The curve at temperature
is a
constant quantity, independent of pressure P. This signifies the ideal gas
behaviour.
(b)
The curve at temperature ![]() is
closer to the dotted plot than the curve at temperature
is
closer to the dotted plot than the curve at temperature![]() . As the
behaviour of a real gas approaches the behaviour of a perfect gas when
temperature is increased, therefore,
. As the
behaviour of a real gas approaches the behaviour of a perfect gas when
temperature is increased, therefore,![]() .
(c)
Where the two curves meet, the value Of PV/T on Y-axis is equal to
.
(c)
Where the two curves meet, the value Of PV/T on Y-axis is equal to ![]() R
As mass of oxygen gas =
R
As mass of oxygen gas = ![]()
![]()
![]() (d)
If we obtained similar plots for
(d)
If we obtained similar plots for ![]() kg
of hydrogen, we will not get the same value of PV/T at the point, where the
curves meet on the Y-axis. This is because molecular mass of hydrogen is
different from that of oxygen.
For
the same value of
kg
of hydrogen, we will not get the same value of PV/T at the point, where the
curves meet on the Y-axis. This is because molecular mass of hydrogen is
different from that of oxygen.
For
the same value of ![]() ,
mass of hydrogen required is obtained from
,
mass of hydrogen required is obtained from
![]()
![]() gram
gram ![]() gram.
gram.


You need to login to perform this action.
You will be redirected in
3 sec

