9th Class Science Matter in Our Surroundings

  • question_answer 46)
      A glass tumbler containing hot water is kept in the freezer compartment of a refrigerator (temperature < 0° C). If you could measure the temperature of the content of the tumbler, which of the following graphs would correctly represent the change in its temperature as a function of time (a)                                                    (b) (c)                                                     (d)  

    Answer:

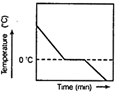
      (a) Figure (a) represents the change of temperature with time correctly. The temperature of water first decreases up to zero degree celcius, then remains constant for some time (till the ice is formed), then again starts decreasing.


You need to login to perform this action.
You will be redirected in 3 sec spinner