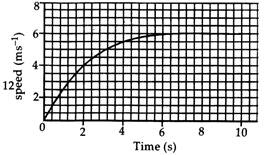
 (a) Find how far does the car travel in the first 4 seconds. Shade the area on the graph that represents the distance travelled by the car during the period.
(b) Which part of the graph represents uniform motion of the car?
(a) Find how far does the car travel in the first 4 seconds. Shade the area on the graph that represents the distance travelled by the car during the period.
(b) Which part of the graph represents uniform motion of the car?
Answer:
The motion during first 4 seconds is not uniformly accelerated. So, distance travelled by car in first 4 seconds is calculated by graphical method.
(a) Area of a small division on the graph
![]() Total number of small divisions under the curve up to 4 s = 1615
Area under the curve up to
Total number of small divisions under the curve up to 4 s = 1615
Area under the curve up to ![]()
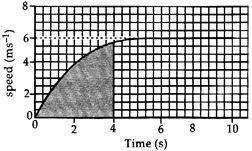 Therefore, the car has covered a distance of 17.2 m in first 4 s.
(b) The limiting flat portion of the curve describes the constant speed of the car, i.e., a speed of 6.7 m
Therefore, the car has covered a distance of 17.2 m in first 4 s.
(b) The limiting flat portion of the curve describes the constant speed of the car, i.e., a speed of 6.7 m ![]() At this stage, the acceleration of the car is zero.
Therefore, portion of the graph beyond 6.2 s describes the uniform motion of the car.
At this stage, the acceleration of the car is zero.
Therefore, portion of the graph beyond 6.2 s describes the uniform motion of the car.


You need to login to perform this action.
You will be redirected in
3 sec

