| Years | Number of animals |
| 1996 | 400 |
| 1998 | 535 |
| 2000 | 472 |
| 2002 | 600 |
| 2004 | 623 |
Answer:
(A) According to the question, 100 students can be represented by = 1 symbol \[\overset{\text{O}}{\mathop{\updownarrow }}\,\] \[\therefore \]1 student can be represented by\[\frac{1}{100}\] symbols Now, for year 1996, 400 students can be represented by \[\frac{400\times 1}{100}=5\] symbols For year 1998, 535 students can be represented by \[\frac{535\times 1}{100}=5\] symbols + 35 students = 5 complete symbols and 1 incomplete symbol For year 2000, 472 students can be represented by \[\frac{472\times 1}{100}\] = 4 complete symbols + 72 students = 4 complete symbols and 1 incomplete symbol For year 2002, 600 students can be represented by \[\frac{600\times 1}{100}\] = 6 complete symbols For year 2004, 623 students can be represented by \[\frac{623\times 1}{600}\] 6 complete symbol +23 students = 6 complete symbols and 1 incomplete symbol Hence, the required pictograph of given data is shown below  (a) 6 symbols represent total number of students in the year 2002. (b) 5 complete symbols and 1 incomplete symbol represent total number of students for the year 1998. (B) According to the question, 50 students can be represented by 1 symbol \[\therefore \]1 student can be represented by \[\frac{1}{50}\]symbols Now, for year 1996, 400 students can be represented by\[\frac{400\times 1}{50}\] symbols \[=\frac{400}{50}=8\] complete symbols For year 1998, 535 students can be represented by \[\frac{535\times 1}{50}=\frac{535}{50}\] symbols = 10 complete symbols + 1 incomplete symbol For year 2000, 472 students can be represented by \[\frac{472\times 1}{50}\] symbols \[=\frac{472}{50}=9\]complete symbols + 1 incomplete symbol For year 2002, 600 students can be represented by \[\frac{600\times 1}{50}\] symbols \[=\frac{600}{50}=12\]complete symbols For year 2004, 623 students can be represented by \[\frac{623\times 1}{50}\] symbols \[=\frac{623}{50}=12\]complete symbols + 1 incomplete symbol Hence, the required pictograph of given data is shown below
 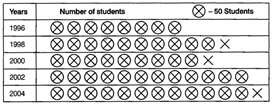 Therefore, we observe that pictograph B is more informative because it gives better approximation.


You need to login to perform this action.
You will be redirected in
3 sec

