 (ii)
(ii) 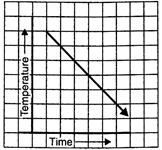 (iii)
(iii) 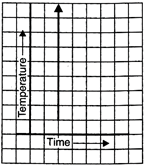 (iv)
(iv) 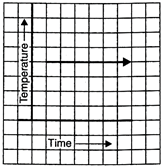
Answer:
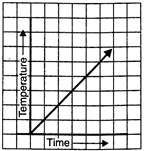
(i) It shows a time-temperature graph. It shows increase in temperature with increase in time. (ii) It shows a time-temperature graph. It shows decrease in temperature with increase in time. (iii) It cannot be a time-temperature graph because it shows many-many different temperatures at one particular time. (iv) It shows a time-temperature graph. It shows a fixed temperature at different times.


You need to login to perform this action.
You will be redirected in
3 sec

