Velocity Time Graph
Category : NEET
Velocity Time Graph
The graph is plotted by taking time t along x-axis and velocity of the particle on y-axis.
Distance and displacement: The area covered between the velocity time graph and time axis gives the displacement and distance travelled by the body for a given time interval.

Then Total distance \[=\,|{{A}_{1}}|\,+\,|{{A}_{2}}|\,+\,|{{A}_{3}}|\,\]
= Addition of modulus of different area. i.e. \[s\,=\,\int{|\upsilon |\,dt}\]
Total displacement \[={{A}_{1}}+{{A}_{2}}+{{A}_{3}}\]
= Addition of different area considering their sign. i.e. \[r\,=\,\int{\upsilon \,dt}\]
here \[{{\operatorname{A}}_{1}}\,\,and {{A}_{2}}\] are area of triangle 1 and 2 respectively and \[{{A}_{3}}\] is the area of trapezium.
Acceleration: Let AB is a velocity-time graph for any moving particle
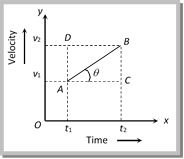
As \[Acceleration\text{ }=\frac{\text{Change in velocity}}{\text{Time taken}}=\frac{{{v}_{2}}-{{v}_{1}}}{{{t}_{2}}-{{t}_{1}}}\] .… (i)
From triangle ABC, \[\tan \theta =\frac{BC}{AC}=\frac{AD}{AC}=\frac{{{v}_{2}}-{{v}_{1}}}{{{t}_{2}}-{{t}_{1}}}\] …. (ii)
By comparing (i) and (ii)
Acceleration (a) \[=\tan \theta \]
It is clear that slope of velocity-time graph represents the acceleration of the particle.
Various velocity – time graphs and their interpretation
 |
q = 0, a = 0, v = constant i.e., line parallel to time axis represents that the particle is moving with constant velocity. |
  |
q = 90o, a = ¥, v = increasing i.e., line perpendicular to time axis represents that the particle is increasing its velocity, but time does not change. It means the particle possesses infinite acceleration. Practically it is not possible. |
 |
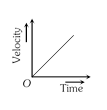
q =constant, so a = constant and v is increasing uniformly with time i.e., line with constant slope represents uniform acceleration of the particle. |
 |
q increasing so acceleration increasing i.e., line bending towards velocity axis represent the increasing acceleration in the body. |
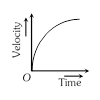
| q decreasing so acceleration decreasing i.e. line bending towards time axis represents the decreasing acceleration in the body | |
 |
Positive constant acceleration because q is constant and < 90o but initial velocity of the particle is negative. |
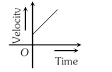 |
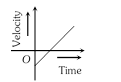
Positive constant acceleration because q is constant and < 90o but initial velocity of particle is positive. |
 |
Negative constant acceleration because q is constant and > 90o but initial velocity of the particle is positive. |
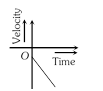 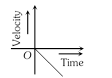 |
Negative constant acceleration because q is constant and > 90o but initial velocity of the particle is zero. |
| Negative constant acceleration because q is constant and > 90o but initial velocity of the particle is negative. |
Sample problems based on velocity-time graph
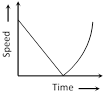
Problem 26. A ball is thrown vertically upwards. Which of the following plots represents the speed-time graph of the ball during its flight if the air resistance is not ignored [AIIMS 2003]
 (b)
(b) 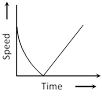 (c)
(c) 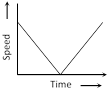 (d)
(d) 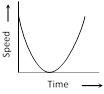
Solution: (c) In first half of motion the acceleration is uniform & velocity gradually decreases, so slope will be negative but for next half acceleration is positive. So slope will be positive. Thus graph ‘C’ is correct.
Not ignoring air resistance means upward motion will have acceleration (a + g) and the downward motion will have \[(g-a).\]
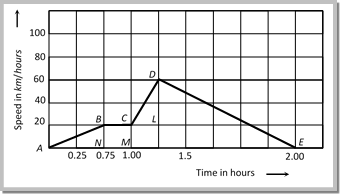
Problem 27. A train moves from one station to another in 2 hours time. Its speed-time graph during this motion is shown in the figure. The maximum acceleration during the journey is [Kerala (Engg.) 2002]
(a) \[140 km {{h}^{2}}\] (b) \[160 km {{h}^{2}}\]
(c) \[100 km {{h}^{2}}\] (d) \[120 km {{h}^{2}}\]
Solution: (b) Maximum acceleration means maximum slope in speed – time graph.
that slope is for line CD. So, \[{{a}_{\max }}=\] slope of CD =\[\frac{60-20}{1.25-1.00}=\frac{40}{0.25}=160km\,{{h}^{-2}}\].
Problem 28. The graph of displacement v/s time is
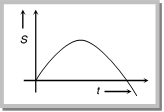
Its corresponding velocity-time graph will be [DCE 2001]
(a) 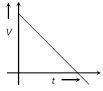 (b)
(b) 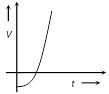 (c)
(c)  (d)
(d) 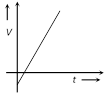
Solution: (a) We know that the velocity of body is given by the slope of displacement – time graph. So it is clear that initially slope of the graph is positive and after some time it becomes zero (corresponding to the peak of the graph) and then it will be negative.
Problem 29. In the following graph, distance travelled by the body in metres is [EAMCET 1994]
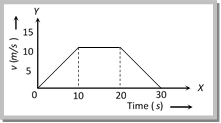
(a) 200 (b) 250
(c) 300 (d) 400
Solution: (a) Distance = The area under v – t graph
\[S=\frac{1}{2}(30+10)\times 10=\text{ }200\text{ }metre\]
Problem 30. For the velocity-time graph shown in figure below the distance covered by the body in last two seconds of its motion is what fraction of the total distance covered by it in all the seven seconds [MP PMT/PET 1998; RPET 2001]
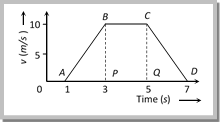
(a) \[\frac{1}{2}\] (b) \[\frac{1}{4}\]
(c) \[\frac{1}{3}\] (d) \[\frac{2}{3}\]
Solution: (b) Distance covered in total 7 seconds = Area of trapezium \[ABCD=\frac{1}{2}(2+6)\times 10=\text{ }40\text{ }m\]
\[=\frac{1}{2}(2+6)\times 10=\text{ }40\text{ }m\]
Distance covered in last 2 second = area of triangle \[CDQ=\frac{1}{2}\times 2\times 10=10\,m\]
So required fraction \[=\frac{10}{40}=\frac{1}{4}\]
Problem 31. The velocity time graph of a body moving in a straight line is shown in the figure. The displacement and distance travelled by the body in 6 sec are respectively [MP PET 1994]
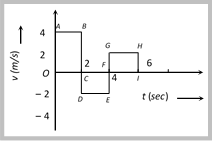
(a) \[8\,m,\,16\,m\] (b) \[16\,m,\,8\,m\]
(c) \[16\,m,\,16\,m\] (d) \[8\,m,\,8\,m\]
Solution: (a) Area of rectangle \[\operatorname{ABCO} = 4\,\times \,\,2 = 8 m\]
\[\operatorname{Area} of rectangle CDEF = \,2 \,\times \, \left( 2 \right) = \,4 m\]
\[\operatorname{Area} of rectangle FGHI = 2\times 2 = 4 m\]
Displacement = sum of area with their sign \[= 8 + \left( 4 \right) + 4 = 8 m\]
Distance = sum of area without sign \[= 8 + 4 + 4 = 16 m\]
Problem 32. A ball is thrown vertically upward which of the following graph represents velocity time graph of the ball during its flight (air resistance is neglected) [CPMT 1993; AMU (Engg.) 2000]
(a) 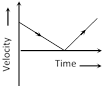 (b)
(b) 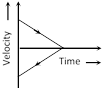 (c)
(c) 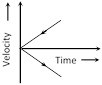 (d)
(d) 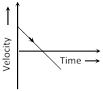
Solution: (d) In the positive region the velocity decreases linearly (during rise) and in negative region velocity increase linearly (during fall) and the direction is opposite to each other during rise and fall, hence fall is shown in the negative region.
Problem 33. A ball is dropped vertically from a height d above the ground. It hits the ground and bounces up vertically to a height \[\frac{d}{2}\]. Neglecting subsequent motion and air resistance, its velocity \[\upsilon \] varies with the height h above the ground as. [IIT-JEE (Screening) 2000]
(a)  (b)
(b)  (c)
(c)  (d)
(d) 
Solution: (a) When ball is dropped from height d its velocity will be zero.
As ball comes downward h decreases and \[\upsilon \] increases just before the rebound from the earth
h = 0 and v = maximum and just after rebound velocity reduces to half and direction becomes opposite.
As soon as the height increases its velocity decreases and becomes zero at \[h=\frac{d}{2}\].
This interpretation is clearly shown by graph (a).
Problem 34. The acceleration-time graph of a body is shown below -
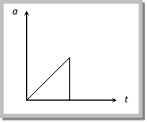
The most probable velocity-time graph of the body is
(a) 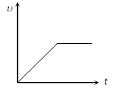 (b)
(b) 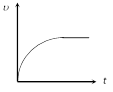 (c)
(c) 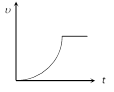 (d)
(d) 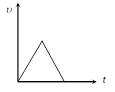
Solution: (c) From given \[a-t\] graph acceleration is increasing at constant rate
\[\therefore \,\,\,\frac{da}{dt}=k\] (constant) \[\Rightarrow \,\,a=kt\] (by integration)
\[\Rightarrow \frac{dv}{dt}=kt\Rightarrow dv=ktdt\Rightarrow \int_{{}}^{{}}{dv}=k\int_{{}}^{{}}{tdt}\Rightarrow v=\frac{k{{t}^{2}}}{2}\]
i.e., v is dependent on time parabolically and parabola is symmetric about v-axis.
and suddenly acceleration becomes zero. i.e. velocity becomes constant.
Hence (c) is most probable graph.
Problem 35. Which of the following velocity time graphs is not possible
(a) 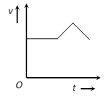 (b)
(b) 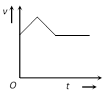 (c)
(c)  (d)
(d) 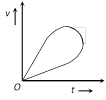
Solution: (d) Particle cannot possess two velocities at a single instant so graph (d) is not possible.
Problem 36. For a certain body, the velocity-time graph is shown in the figure. The ratio of applied forces for intervals AB and BC is
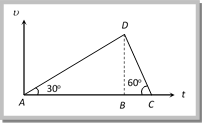
(a) \[+\frac{1}{2}\] (b) \[-\frac{1}{2}\]
(c) \[+\frac{1}{3}\] (d) \[-\frac{1}{3}\]
Solution: (d) Ratio of applied force = Ratio of acceleration
\[=\,\frac{{{a}_{AB}}}{{{a}_{BC}}}\,=\,\frac{\tan 30}{\tan \left( 120 \right)}=\,\,\frac{{1}/{\sqrt{3}}\;}{-\sqrt{3}}=-{1}/{3}\;\]
Problem 37. Velocity-time graphs of two cars which start from rest at the same time, are shown in the figure. Graph shows, that
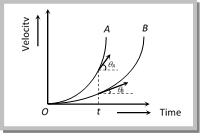
(a) Initial velocity of A is greater than the initial velocity of B
(b) Acceleration in A is increasing at lesser rate than in B
(c) Acceleration in A is greater than in B
(d) Acceleration in B is greater than in A
Solution: (c) At a certain instant t slope of A is greater than \[B\left( {{\theta }_{A}}>{{\theta }_{B}} \right)\], so acceleration in A is greater than B
Problem 38. Which one of the following graphs represent the velocity of a steel ball which fall from a height on to a marble floor? (Here \[\upsilon \] represents the velocity of the particle and t the time)
(a) 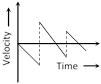 (b)
(b) 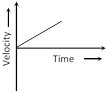 (c)
(c) 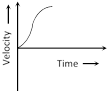 (d)
(d) 
Solution: (a) Initially when ball falls from a height its velocity is zero and goes on increasing when it comes down. Just after rebound from the earth its velocity decreases in magnitude and its direction gets reversed. This process is repeated until ball comes to at rest. This interpretation is well explained in graph (a).
Problem 39. The adjoining curve represents the velocity-time graph of a particle, its acceleration values along OA, AB and BC in \[\operatorname{metre}/se{{c}^{2}}\] are respectively
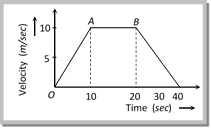
(a) 1, 0, – 0.5 (b) 1, 0, 0.5
(c) 1, 1, 0.5 (d) 1, 0.5, 0
Solution: (a) Acceleration along \[OA=\frac{{{v}_{2}}-{{v}_{1}}}{t}=\frac{10-0}{10}=1m/{{s}^{2}}\]
Acceleration along \[OB=\frac{0}{10}=0\]
Acceleration along \[BC=\,\frac{0-10}{20}=~\text{ }0.5\text{ }m/{{s}^{2}}\]


You need to login to perform this action.
You will be redirected in
3 sec

