-
question_answer1)
DIRECTION: Study the following table which shows the production of three different types of cars over the years.
| Years | Production of Car P | Production of Car Q | Production of Car R |
| 2001 | 76 | 59 | 28 |
| 2002 | 82 | 62 | 36 |
| 2003 | 65 | 47 | 42 |
| 2004 | 70 | 54 | 31 |
| 2005 | 85 | 57 | 49 |
| 2006 | 80 | 68 | 38 |
The average production of which of the following types of cars was maximum?
A)
Q done
clear
B)
P done
clear
C)
R done
clear
D)
All are equal done
clear
View Solution play_arrow
-
question_answer2)
DIRECTION: Study the following table which shows the production of three different types of cars over the years.
| Years | Production of Car P | Production of Car Q | Production of Car R |
| 2001 | 76 | 59 | 28 |
| 2002 | 82 | 62 | 36 |
| 2003 | 65 | 47 | 42 |
| 2004 | 70 | 54 | 31 |
| 2005 | 85 | 57 | 49 |
| 2006 | 80 | 68 | 38 |
The difference between the total production of three cars in the year 2004 and 2006 is
A)
11 done
clear
B)
43 done
clear
C)
31 done
clear
D)
28 done
clear
View Solution play_arrow
-
question_answer3)
The heights of 10 students were measured in cm and the results are as follows: 147,139,135,136,149, 166, 152, 163, 155, 144.
| (i) What is the range of the data? |
| (ii) What is the mean height of the students? |
| (iii) How many students are there whose height is more than the mean height? |
A)
B)
C)
D)
View Solution play_arrow
-
question_answer4)
The mode and median of the following data 21, 23, 25. 23, 21, 24, 22, 20, 23 respectively, are
A)
23, 23 done
clear
B)
21, 23 done
clear
C)
25, 21 done
clear
D)
23, 21 done
clear
View Solution play_arrow
-
question_answer5)
Mean of 9 observations was found to be 35. Later on, it was detected that an observation 81 was misread as 18, then the correct mean of the observations is
A)
40 done
clear
B)
41 done
clear
C)
42 done
clear
D)
43 done
clear
View Solution play_arrow
-
question_answer6)
If the mean of 6, 8, 5, x and 4 is 7, then the value of x is ____.
A)
11 done
clear
B)
12 done
clear
C)
13 done
clear
D)
14 done
clear
View Solution play_arrow
-
question_answer7)
The mode of the following distribution is
| Size | 2 | 3 | 4 | 5 | 6 | 7 | 8 |
| Frequency | 10 | 12 | 25 | 20 | 25 | 15 | 11 |
A)
2 done
clear
B)
8 done
clear
C)
Both 4 and 6 done
clear
D)
5 done
clear
View Solution play_arrow
-
question_answer8)
The mean of 5 numbers is 20. If one number is excluded, mean of the remaining numbers becomes 23, then the excluded number is ____.
A)
4 done
clear
B)
92 done
clear
C)
100 done
clear
D)
8 done
clear
View Solution play_arrow
-
question_answer9)
The median value of the given data is 98, 75, 96, 180, 270, 102, 94, 100, 610, 200,75, 80
A)
100 done
clear
B)
98 done
clear
C)
97 done
clear
D)
99 done
clear
View Solution play_arrow
-
question_answer10)
| DIRECTION: The given bar graph shows the marks obtained by a student in different subjects. The maximum marks of each subject is 100. |
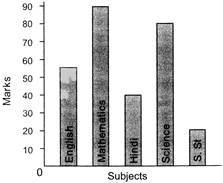 |
In which subject did the student score highest marks?
A)
English done
clear
B)
Mathematics done
clear
C)
Science done
clear
D)
S.St done
clear
View Solution play_arrow
-
question_answer11)
| DIRECTION: The given bar graph shows the marks obtained by a student in different subjects. The maximum marks of each subject is 100. |
| |
What is the average marks obtained by the student?
A)
57 done
clear
B)
63 done
clear
C)
80 done
clear
D)
48 done
clear
View Solution play_arrow
-
question_answer12)
| DIRECTION: The given bar graph shows the marks obtained by a student in different subjects. The maximum marks of each subject is 100. |
| |
What is the percentage of marks obtained by the student?
A)
80% done
clear
B)
63% done
clear
C)
57% done
clear
D)
90% done
clear
View Solution play_arrow
-
question_answer13)
| DIRECTION: The given bar graph shows the marks obtained by a student in different subjects. The maximum marks of each subject is 100. |
 |
What is the ratio of the highest marks to the lowest marks obtained by the student?
A)
\[2:11\] done
clear
B)
\[9:2\] done
clear
C)
\[2:9\] done
clear
D)
\[11:2\] done
clear
View Solution play_arrow
-
question_answer14)
The given bar graph shows the production of Rice and Wheat in five states.
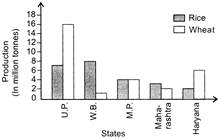
Which of the following states is the largest producer of wheat?
A)
M.P. done
clear
B)
Haryana done
clear
C)
Maharashtra done
clear
D)
U.P. done
clear
View Solution play_arrow
-
question_answer15)
Which of the following statements is INCORRECT?
A)
Mean, Median and Mode may be same for some data. done
clear
B)
The probability of getting an ace out of a deck of cards is less than 1. done
clear
C)
Mean of the data is always from the given data. done
clear
D)
Median of the data may or may not be from the given data. done
clear
View Solution play_arrow
-
question_answer16)
The choices of the fruits of 42 students in a class are as follows:
| A | O | B | M | A | G | B | G | A | G | B | M | A | G |
| M | A | B | G | M | B | A | O | M | O | G | B | O | M |
| G | A | A | B | M | O | M | G | B | A | M | O | M | O |
where A, B, G, M and O stands for Apple, Banana, Grapes, Mango and Orange respectively. Which two fruits are liked by an equal number of students?
A)
Apple and Mango done
clear
B)
Mango and Banana done
clear
C)
Banana and Orange done
clear
D)
Banana and Grapes done
clear
View Solution play_arrow
-
question_answer17)
Garima collected the data regarding weights of students of her class and prepared the following table:
| Weight (in kg) | 44-49 | 50-55 | 56-61 | 62-67 |
| Number of students | 8 | 15 | 25 | 17 |
A student is to be selected randomly from her class for some competition. The probability of selection of the student is highest whose weight (in kg) is in the interval ____.
A)
44-49 done
clear
B)
56-61 done
clear
C)
50-55 done
clear
D)
62-67 done
clear
View Solution play_arrow
-
question_answer18)
Soni has digit cards 1, 4 and 7. She makes 2-digit number using each card only once. The probability that a 2-digit number chosen at random is divisible by 2 Is:
A)
\[\frac{1}{3}\] done
clear
B)
\[\frac{2}{3}\] done
clear
C)
0 done
clear
D)
\[\frac{1}{2}\] done
clear
View Solution play_arrow
-
question_answer19)
A bag contains red, white and blue pencils. The probability of selecting a red pencil is \[\frac{2}{13}\] and that of selecting a blue pencil is \[\frac{4}{13}\] . Find the probability of selecting a white pencil.
A)
\[\frac{6}{13}\] done
clear
B)
\[\frac{7}{13}\] done
clear
C)
\[\frac{3}{5}\] done
clear
D)
\[\frac{2}{5}\] done
clear
View Solution play_arrow
-
question_answer20)
A fair dice has faces numbered 0,1, 7, 3, 5 and 9. If it is thrown, the probability of getting an odd number is
A)
1 done
clear
B)
\[\frac{2}{3}\] done
clear
C)
\[\frac{5}{6}\] done
clear
D)
\[\frac{1}{6}\] done
clear
View Solution play_arrow
-
question_answer21)
The line graph shows the number of storybooks Armaan read in the last 4 months of a year.
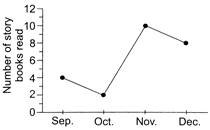
The number of storybooks that he read in October as a fraction of the total number of storybooks read is
A)
\[\frac{1}{12}\] done
clear
B)
\[\frac{3}{4}\] done
clear
C)
\[\frac{1}{2}\] done
clear
D)
\[\frac{5}{12}\] done
clear
View Solution play_arrow
-
question_answer22)
If weights of 9 students (in kg) of a particular class are: 34, 35, 36, 40, 35, 35, 40, 45, 39, Which of the following is in the order from the least to the greatest?
A)
Mean, Mode, Median done
clear
B)
Mean, Median, Mode done
clear
C)
Mode, Median, Mean done
clear
D)
Mode, Mean, Median done
clear
View Solution play_arrow
-
question_answer23)
The given line graph shows the number of toy bikes sold by Robin over 5 days.
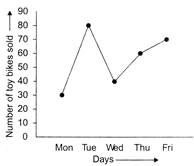
If the cost of 1 toy bike is Rs. 33.60, then how much did he earn in 5 days?
A)
Rs.9408 done
clear
B)
Rs.9240 done
clear
C)
Rs.8400 done
clear
D)
Rs.8408 done
clear
View Solution play_arrow
-
question_answer24)
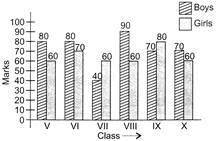
The given bar graph shows the demand and production of colour TVs of five companies.
In which standard is the result of the girls more than the average result of the boys from the school?
A)
IX done
clear
B)
VIII done
clear
C)
VI done
clear
D)
X done
clear
View Solution play_arrow
-
question_answer25)
The given bar graph shows the result of annual examination in a school from class V to class X.
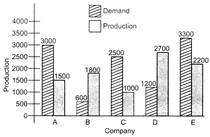
What is the difference between average demand and average production of the five companies taken together?
A)
1400 done
clear
B)
400 done
clear
C)
280 done
clear
D)
138 done
clear
View Solution play_arrow


