question_answer 1)
A bag has 4 red balls and 2 yellow balls. (The balls are identical in all respect other than colour). A ball is drawn from the bag without looking into the bag. The probability of getting a red ball is __.
A)
done
clear
B)
done
clear
C)
done
clear
D)
done
clear
View Solution play_arrow
question_answer 2)
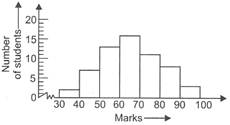
DIRECTION: The histogram representing the marks obtained by 60 students in a Mathematics examination. What is the total number of students who obtained more than or equal to 80 marks in the examination?
A)
done
clear
B)
done
clear
C)
done
clear
D)
done
clear
View Solution play_arrow
question_answer 3)
DIRECTION: The histogram representing the marks obtained by 60 students in a Mathematics examination. If the minimum pass marks was 40, how many students failed?
A)
done
clear
B)
done
clear
C)
done
clear
D)
done
clear
View Solution play_arrow
question_answer 4)
DIRECTION: The histogram representing the marks obtained by 60 students in a Mathematics examination. How many students were awarded merit, if the minimum marks required for it are 80?
A)
done
clear
B)
done
clear
C)
done
clear
D)
done
clear
View Solution play_arrow
question_answer 5)
A die is thrown. The probability of getting a multiple of 3 is __.
A)
done
clear
B)
done
clear
C)
done
clear
D)
done
clear
View Solution play_arrow
question_answer 6)
From the given table, the number of students who got more than or equal to 50 marks, is __.
Marks (class-interval) No. of students 30-40 12 40-50 13 50-60 4 60-70 15 70-80 6
A)
done
clear
B)
done
clear
C)
done
clear
D)
done
clear
View Solution play_arrow
question_answer 7)
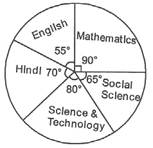
The given pie chart gives the marks scored in an examination by a student in English, Hindi, Science & Technology, Social Science and Mathematics. If the total marks obtained by the student were 540, then the subject in which the student scored 105 marks, is____.
A)
done
clear
B)
done
clear
C)
done
clear
D)
done
clear
View Solution play_arrow
question_answer 8)
The probability of occurrence of an event is ____.
A)
done
clear
B)
done
clear
C)
done
clear
D)
done
clear
View Solution play_arrow
question_answer 9)
In a survey of 200 ladies, it was found that 82 like coffee while 118 dislike it. From these ladies, one is chosen at random. The probability that the chosen lady dislike coffee is ____.
A)
done
clear
B)
done
clear
C)
done
clear
D)
done
clear
View Solution play_arrow
question_answer 10)
The number of times a particular entry occurs in a set of data is known as its
A)
done
clear
B)
done
clear
C)
done
clear
D)
done
clear
View Solution play_arrow
question_answer 11)
The mid-value of a class-Interval is called its
A)
done
clear
B)
done
clear
C)
done
clear
D)
done
clear
View Solution play_arrow
question_answer 12)
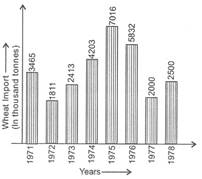
DIRECTION: Study the graph carefully and answer the questions given below it.
In which year did the wheat import register highest increase over its preceding year?
A)
done
clear
B)
done
clear
C)
done
clear
D)
done
clear
View Solution play_arrow
question_answer 13)
DIRECTION: Study the graph carefully and answer the questions given below it.
The wheat import in 1976 was approximately how many times to that of the year 1972?
A)
done
clear
B)
done
clear
C)
done
clear
D)
done
clear
View Solution play_arrow
question_answer 14)
DIRECTION: Study the graph carefully and answer the questions given below it.
The increase in wheat import in 1978 was what percent of the wheat import in 1977?
A)
done
clear
B)
done
clear
C)
done
clear
D)
done
clear
View Solution play_arrow
question_answer 15)
DIRECTION: Study the graph carefully and answer the questions given below it.
The wheat import in 1974 is approximately what percent of the average wheat import for the given years?
A)
done
clear
B)
done
clear
C)
done
clear
D)
done
clear
View Solution play_arrow
question_answer 16)
In a school only 3 out of 5 students can participate in a competition. What is the probability of the students who do not make it to the competition?
A)
done
clear
B)
done
clear
C)
done
clear
D)
done
clear
View Solution play_arrow
question_answer 17)
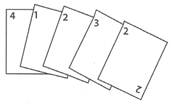
Rohan and Shalu are playing with 5 cards as shown in the figure. What is the probability of Rohan picking a card without seeing, that has the number 2 on it?
A)
done
clear
B)
done
clear
C)
done
clear
D)
done
clear
View Solution play_arrow
question_answer 18)
Monthly salary of a person is Rs. 15000. The central angle of the sector representing his expenses on food and house rent on a pie chart is \[\text{60 }\!\!{}^\circ\!\!\text{ }\]. The amount he spends on food and house rent is
A)
done
clear
B)
done
clear
C)
done
clear
D)
done
clear
View Solution play_arrow
question_answer 19)
A glass Jar contains 6 red, 5 green, 4 blue and 5 yellow marbles of same size. Hari takes out a marble from the jar at random. What is the probability that the chosen marble is of red colour?
A)
done
clear
B)
done
clear
C)
done
clear
D)
done
clear
View Solution play_arrow
question_answer 20)
Ram put some buttons on the table. There were 4 blue, 7 red, 3 black and 6 white buttons In all. All of a sudden, a cat Jumped on the table and knocked out one button on the floor. What is the probability that the button on the floor is blue?
A)
done
clear
B)
done
clear
C)
done
clear
D)
done
clear
View Solution play_arrow
question_answer 21)
DIRECTION: The given pie chart shows the spending of a family on various heads during a month. Study the graph and answer the questions.
If the total income of the family is Rs. 25000, then the amount spent on rent and food together is ___.
A)
done
clear
B)
done
clear
C)
done
clear
D)
done
clear
View Solution play_arrow
question_answer 22)
DIRECTION: The given pie chart shows the spending of a family on various heads during a month. Study the graph and answer the questions.
What is the ratio of the expenses on education to the expenses on food?
A)
done
clear
B)
done
clear
C)
done
clear
D)
done
clear
View Solution play_arrow
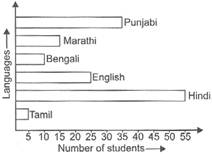
question_answer 23)
The given bar graph shows the number of students in a hostel speaking different languages. Study the bar graph and answer the following questions.
(i) How many students are there in, the hostel? (ii) What is the ratio of the number of students speaking Punjabi to those speaking English? (iii) What is the percentage of the students speaking Marathi over those speaking Hindi?
A)
B)
C)
D)
View Solution play_arrow
question_answer 24)
Look at the given below data.
39, 25, 5, 33, 19, 21, 12, 48, 13, 21, 9, 1, 10, 8, 12, 17, 41, 40, 12, 46, 37, 17. 27, 30, 6, 2, 23, 19
The frequency distribution of the data is given here.
P Group Tally Marks Frequency 0-10 \[\bcancel{||||}|\] 6 10-20 \[\bcancel{\text{ }\!\!|\!\!\text{ }\!\!|\!\!\text{ }\!\!|\!\!\text{ }\!\!|\!\!\text{ }}\text{ }\bcancel{\text{ }\!\!|\!\!\text{ }\!\!|\!\!\text{ }\!\!|\!\!\text{ }\!\!|\!\!\text{ }}|\] 11 20-30 \[||||\] 4 30-40 \[\bcancel{||||}\] 5 40-50 \[|||\] 3
Q Group Tally Marks Frequency 0-10 \[\bcancel{||||}|\] 6 10-20 \[\bcancel{||||}\bcancel{||||}\] 10 20-30 \[\bcancel{||||}\] 5 30-40 \[||||\] 4 40-50 \[||||\] 4
Which of the above tables is the frequency table of the given data.
A)
done
clear
B)
done
clear
C)
done
clear
D)
done
clear
View Solution play_arrow
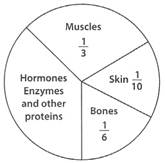
question_answer 25)
The given pie chart represents the distribution of proteins in parts of a human body. What is the ratio of distribution of proteins in the muscles to that of proteins in the bones?
A)
done
clear
B)
done
clear
C)
done
clear
D)
done
clear
View Solution play_arrow