0
question_answer1) The median of the following data: 36, 46, 32, 42, 33, 52, 50, 48, 56, 60, 53, 95, 75, 80, 70 is.
question_answer2) The mean of n observation is X. If the first item is increased by 1, seconds by 2 and so on, then the new mean is
question_answer3) When Ahmed walked through a shopping mall. He recorded the number of customers in each shop. The data is displayed in a dot plot. What percentage of shops had at least 4 customers?
question_answer4) The stem-and-leaf plot alongside shows the ten pin bowling scores of John. What percentage of John?s Scores have been 100 or higher?
question_answer5) A frequency table for the height h of the players in a basketball squad is given alongside. What is the model class? Height-h (cm) Frequency \[170\le h<175\] 1 \[175\le h<180\] 8 \[180\le h<185\] 9 \[185\le h<190\] 11 \[190\le h<195\] 9 \[195\le h<200\] 3 \[200\le h<200\] 3
question_answer6) Student in a Hotel Management College were instructed to bake a cake. The table alongside shows the time taken for the students to complete the task. Students longer than 2 hours received a penalty. What percentage of students received a penalty? Time t (min ) Frequency \[55\le t<60\] 4 \[60\le t<70\] 2 \[70\le t<80\] 5 \[80\le t<90\] 3 \[90\le t<100\] 10 \[100\le t<110\] 8 \[110\le t<120\] 10 \[120\le t<130\] 13 \[130\le t<140\] 5
question_answer7) The data in the table below shows the number of people at each table at a restaurant. What is the median of this data? Number of people 5 6 7 8 9 10 11 12 Frequency 1 0 3 9 12 7 4 2
question_answer8) The table below shows the number of aces scored by tennis players in their first match of tournament What is the mean number of all tor these aces: No of aces 1 2 3 4 5 Frequency 4 11 18 13 7
question_answer9) Sixty people were asked. "How many times have you been in the cinema in the last twelve months? The results are given in the table alongside what is the mean of the data Number of times Frequency 0-5 19 6-10 24 11-15 10 16-20 5 21-25 2
question_answer10) The table below shows the number of passengers in the car at a above in movie theatre. What is the range of given data? No. of passengers 1 2 3 4 5 6 Frequency 2 10 10 17 11 5
question_answer11) The slumber of potatoes growing cm each of 100 potato plants were recorded and summarised in the table below. What is the mean number of potatoes per plant? No. of potatoes 0-2 3-5 6-8 9-11 12-14 15-17 Frequency 7 11 25 40 15 2
question_answer12) The table below shows the no. of passengers in the car's at a drive in movie theatre. How many cars are there in the theatre? No. of passengers 1 2 3 4 5 6 Frequency 2 19 10 17 11 5
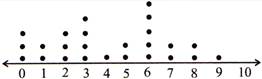
question_answer13) What is the median of (lie dam given below?
question_answer14) What is the mean of the data given below?
question_answer15) The speed of 120 cars measured at a particular point on country road. They are shown in the table alongside. What is the mean speed of the drivers? Speed v (km/h) Frequency \[40\le V<50\] 1 \[50\le V<60\] 3 \[60\le V<70\] 17 \[70\le V<80\] 39 \[80\le V<90\] 48 \[90\le V<100\] 17 \[100\le V<110\] 4
question_answer16) The table alongside shows the area of the blocks of land along a street. What is the modal class of given data? Area \[{{m}^{2}}\] Frequency \[400\le A<500\] 5 \[500\le A<600\] 11 \[600\le A<700\] 12 \[700\le A<800\] 10 \[800\le A<900\] 8
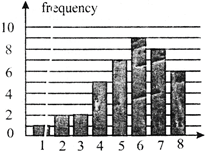
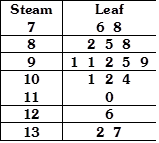
question_answer17) What is the mean of the following data set?
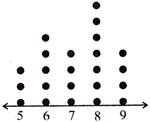
question_answer18) What is the median of the following data set?
question_answer19) A randomly selected sample of small businessmen was asked the following question. How many full time employees are there in their businesses? The results are shown in the bar chart alongside. What percentage of the businessman had five or more full time employees?
question_answer20) Hayden makes deliveries for a white goods store. He score the number of deliveries he make each day for 40 days. On how many days has Hayden made at least 10 deliveries? No. of deliveries Frequency 5 1 6 4 7 8 8 11 9 9 10 5 11 2
question_answer21) Direction: The pie chart given below shows the marks obtained by a student in an examination. If the total marks obtained by him in the examination were 720, answer the questions given below based on this pie chart. In which subject, did the student obtain 110 marks?
question_answer22) Direction: The pie chart given below shows the marks obtained by a student in an examination. If the total marks obtained by him in the examination were 720, answer the questions given below based on this pie chart. What is the central angle corresponding of Maths?
question_answer23) Direction: The pie chart given below shows the marks obtained by a student in an examination. If the total marks obtained by him in the examination were 720, answer the questions given below based on this pie chart. How many more marks were obtained by the student in English than those in Science?
question_answer24) Direction: The pie chart given below shows the marks obtained by a student in an examination. If the total marks obtained by him in the examination were 720, answer the questions given below based on this pie chart. How many marks were obtained by the student in Maths?
question_answer25) Direction: Study the following graph and answer the questions. Find the percentage decrease in income from 2012 to 2013
question_answer26) Direction: Study the following graph and answer the questions. If the income shows positive growth every year throughout the period (2011- 2016), then in how many years the expenditure shows a positive growth?
question_answer27) Direction: Study the bar diagram given below carefully and answer the following questions based on it. The birth-rate of which country is 25% more than that of Netherland?
question_answer28) Direction: Study the bar diagram given below carefully and answer the following questions based on it. The birth rate of India is what percent of the birth rate of Japan?
question_answer29) Direction: Study the bar diagram given below carefully and answer the following questions based on it. The birth rate of Bangladesh is how many times the birth rate of Netherland?
question_answer30) Direction: Study the bar diagram given below carefully and answer the following questions based on it. What is the ratio of birth rate of India to that of France?
question_answer31) Direction: Study the bar diagram given below carefully and answer the following questions based on it. By how much percent is the birth rate of Japan less than the birth rate of Australia?
question_answer32) Direction: Study the bar diagram given below carefully and answer the following questions based on it. The Birth rate of Australia is how many times than the birth rate of Japan?
question_answer33) Direction: Study the bar diagram and answer the questions. The percentage of the girls from Social Science department? compared to (he total number of girls from all the other departments together is
question_answer34) Direction: Study the bar diagram and answer the questions. The difference between the total number of boys and the total number of girls from all the departments together is
question_answer35) Direction: Study the bar diagram and answer the questions. The average number of boys from ail the departments together is
question_answer36) The percentage of the boys from Hindi department compared to the total number of boys from all the department together is
question_answer37) Directions: Study the following table and answer the questions given below. Annual income of five schools. Source of Income Schools P Q R S T Tuition Fee. 100 50 200 100 100 Term Fee 25 11 45 24 30 Donation 53 22 60 51 50 Grants 60 48 120 42 55 Miscellaneous 12 9 15 3 10 Total 250 140 440 220 245 For School Q, what per cent of the income from miscellaneous is the income from donation?
question_answer38) Directions: Study the following table and answer the questions given below. Annual income of five schools. Source of Income Schools P Q R S T Tuition Fee. 100 50 200 100 100 Term Fee 25 11 45 24 30 Donation 53 22 60 51 50 Grants 60 48 120 42 55 Miscellaneous 12 9 15 3 10 Total 250 140 440 220 245 Which school has the lowest percentage of income from tuition fee out of its total income?
question_answer39) Directions: Study the following table and answer the questions given below. Annual income of five schools. Source of Income Schools P Q R S T Tuition Fee. 100 50 200 100 100 Term Fee 25 11 45 24 30 Donation 53 22 60 51 50 Grants 60 48 120 42 55 Miscellaneous 12 9 15 3 10 Total 250 140 440 220 245 In case of how many schools, is the income by way of tuition fee is less than four times of term fee?
question_answer40) Directions: Study the following table and answer the questions given below. Annual income of five schools. Source of Income Schools P Q R S T Tuition Fee. 100 50 200 100 100 Term Fee 25 11 45 24 30 Donation 53 22 60 51 50 Grants 60 48 120 42 55 Miscellaneous 12 9 15 3 10 Total 250 140 440 220 245 Which school has the lowest ratio of income by way of grants and tuition fee?
Please Wait you are being redirected....
You need to login to perform this action.You will be redirected in 3 sec
OTP has been sent to your mobile number and is valid for one hour
Your mobile number is verified.