0
question_answer1) Study the following table and answer the questions that follow: The table represents the total sales value (in lakhs) of five books P, Q, R, S and T across eight bookstores A, B, C, D, E, F, G and H. BOOKS BOOK STORES A B C D E F G H P 560 590 210 670 560 680 420 460 Q 550 560 890 230 820 610 520 230 R 450 290 540 530 500 520 560 410 S 230 240 560 400 430 200 210 480 T 230 400 410 240 200 360 500 470 What is the ratio the total sales values of Book P across all the bookstores and Book S across all the bookstores?
question_answer2) Study the following table and answer the questions that follow: The table represents the total sales value (in lakhs) of five books P, Q, R, S and T across eight bookstores A, B, C, D, E, F, G and H. BOOKS BOOK STORES A B C D E F G H P 560 590 210 670 560 680 420 460 Q 550 560 890 230 820 610 520 230 R 450 290 540 530 500 520 560 410 S 230 240 560 400 430 200 210 480 T 230 400 410 240 200 360 500 470 The sale of the book R from Bookstore H is what per cent of the total sale of Book R across all the bookstores, (rounded off to two places after the decimal)?
question_answer3) Study the following table and answer the questions that follow: The table represents the total sales value (in lakhs) of five books P, Q, R, S and T across eight bookstores A, B, C, D, E, F, G and H. BOOKS BOOK STORES A B C D E F G H P 560 590 210 670 560 680 420 460 Q 550 560 890 230 820 610 520 230 R 450 290 540 530 500 520 560 410 S 230 240 560 400 430 200 210 480 T 230 400 410 240 200 360 500 470 What is the average sale (in lakh) of Bookstore E?
question_answer4) Study the following table and answer the questions that follow: The table represents the total sales value (in lakhs) of five books P, Q, R, S and T across eight bookstores A, B, C, D, E, F, G and H. BOOKS BOOK STORES A B C D E F G H P 560 590 210 670 560 680 420 460 Q 550 560 890 230 820 610 520 230 R 450 290 540 530 500 520 560 410 S 230 240 560 400 430 200 210 480 T 230 400 410 240 200 360 500 470 Book Q constituted approximately what per cent of the total sales of Bookstore C?
question_answer5) Study the following table and answer the questions that follow: The table represents the total sales value (in lakhs) of five books P, Q, R, S and T across eight bookstores A, B, C, D, E, F, G and H. BOOKS BOOK STORES A B C D E F G H P 560 590 210 670 560 680 420 460 Q 550 560 890 230 820 610 520 230 R 450 290 540 530 500 520 560 410 S 230 240 560 400 430 200 210 480 T 230 400 410 240 200 360 500 470 What is the total sales value (in lakh) of Bookstore D?
question_answer6) The table shows the Cost Price of 5 products divided in 3 costs: Production Cost Transportation Cost and Packaging Cost the selling price profit/loss and profit%/loss%. Some values are missing. Find the answers based on information in table. Product Production Transportation cost Packaging cost Selling Profit /loss Profit/loss% A 80 16 -- 300 -- 5% B 100 20 8 -- -- 30% profit C 90 -- 20 -- 100 -- D 60 12 30 -- -- -- E 120 20 -- 110 -- 10% loss If the percentage of profit on selling product A is \[9\frac{1}{11}%\] then what is its cost of packaing?
question_answer7) The table shows the Cost Price of 5 products divided in 3 costs: Production Cost Transportation Cost and Packaging Cost the selling price profit/loss and profit%/loss%. Some values are missing. Find the answers based on information in table. Product Production Transportation cost Packaging cost Selling Profit /loss Profit/loss% A 80 16 -- 300 -- 5% B 100 20 8 -- -- 30% profit C 90 -- 20 -- 100 -- D 60 12 30 -- -- -- E 120 20 -- 110 -- 10% loss What is the difference between the selling price of products B and C if the cost of transportation of C is Rs 16 and both are sold at profit?
question_answer8) The table shows the Cost Price of 5 products divided in 3 costs: Production Cost, Transportation Cost and Packaging Cost, the selling price, profit/loss and profit%/loss%. Some values are missing. Find the answers based on information in table. Product Production Transportation cost Packaging cost Selling Profit /loss Profit/loss% A 80 16 -- 300 -- 5% B 100 20 8 -- -- 30% profit C 90 -- 20 -- 100 -- D 60 12 30 -- -- -- E 120 20 -- 110 -- 10% loss Suppose all the prices are given for per kg of a product. What amount of product B will have to add to 54 kg of product E such that the resultant product has cost price of Rs 125.
question_answer9) The table shows the Cost Price of 5 products divided in 3 costs: Production Cost, Transportation Cost and Packaging Cost, the selling price, profit/loss and profit%/loss%. Some values are missing. Find the answers based on information in table. Product Production Transportation cost Packaging cost Selling Profit /loss Profit/loss% A 80 16 -- 300 -- 5% B 100 20 8 -- -- 30% profit C 90 -- 20 -- 100 -- D 60 12 30 -- -- -- E 120 20 -- 110 -- 10% loss What is the percentage profit (approximate) on selling product D if its selling price is 80% of the selling price of B?
question_answer10) The table shows the Cost Price of 5 products divided in 3 costs: Production Cost, Transportation Cost and Packaging Cost, the selling price, profit/loss and profit%/loss%. Some values are missing. Find the answers based on information in table. Product Production Transportation cost Packaging cost Selling Profit /loss Profit/loss% A 80 16 -- 300 -- 5% B 100 20 8 -- -- 30% profit C 90 -- 20 -- 100 -- D 60 12 30 -- -- -- E 120 20 -- 110 -- 10% loss If 2 kg of A, 3 kg of C and 4 kg of E are sold, then what will be the final profit/loss % (approximate) on selling these given. Transportation cost of C as Rs 10 and profit of 5% on selling A?
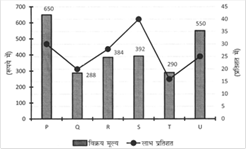
question_answer11) Study the following information carefully and answer the given questions. The following bar graph shows the selling price of an article (In Rs.) and the profit % earned by selling the article. The cost price of article P is approximately what percentage more/less than the cost price of article U?
question_answer12) Study the following information carefully and answer the given questions. The following bar graph shows the selling price of an article (In Rs.) and the profit % earned by selling the article. Manoj sold an article S to Kamran who again sold it at 25 % profit. Find the difference between the profits earned by Manoj to that of Kamran?
question_answer13) Study the following information carefully and answer the given questions. The following bar graph shows the selling price of an article (In Rs.) and the profit % earned by selling the article. Rajesh marked an article Q, which is Rs. 60 above the cost price. How much discount percentage should be given on marked price to earn the given profit?
question_answer14) Study the following information carefully and answer the given questions. The following bar graph shows the selling price of an article (In Rs.) and the profit % earned by selling the article. Find the average cost price of the article P, Q, R and S together. A) Rs. 250 done clear B) Rs. 350 done clear C) Rs. 300 done clear D) Rs. 330 done clear E) None of these done clear
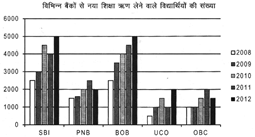
question_answer15) Read the given bar graph and answer the following, questions- If 23% from UCO in 2009 and 20% from PNB in 2010 have defaulter then, find the total number of defaulter of UCO and PNB taken together?
question_answer16) Read the given bar graph and answer the following, questions- In 2007, no of defaulters in SBI was 5%. However each year no of defaulters increases by 10% in number. What will be the difference between the number of defaulters of SBI in the year 2009 and 2012?
question_answer17) Read the given bar graph and answer the following, questions- In which of the following years, the difference, in number of students taking loan from Bank BOB from the previous year is highest?
question_answer18) Read the given bar graph and answer the following, questions- If on average, Rs. 175000 per student's education loan sanctioned by OBC bank all over the year. What will be total amount sanctioned by OBC in all given years?
question_answer19) Read the given bar graph and answer the following, questions- What is the ratio of Number of students taking Education Loans from SBI and BOB together in all the years and the total no of students taking Education loans in 2010 and 2011 together?
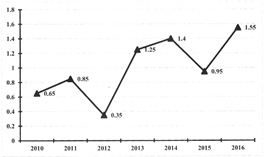
question_answer20) The following Line chart gives the ratio of the amounts of imports by a Company to the amount of exports from that Company over the period from 2011 to 2017. Answer the following questions based on following Line graph. Ratio of value of imports to export In how-many of the given years were the exports more than imports?
question_answer21) The following Line chart gives the ratio of the amounts of imports by a Company to the amount of exports from that Company over the period from 2011 to 2017. Answer the following questions based on following Line graph. Ratio of value of imports to export The imports were minimum proportionate to the exports of the Company in the year
question_answer22) The following Line chart gives the ratio of the amounts of imports by a Company to the amount of exports from that Company over the period from 2011 to 2017. Answer the following questions based on following Line graph. Ratio of value of imports to export If the imports of a company in 2012 was Rs. 272 Corers, the exports from the company in 2012 was
question_answer23) The following Line chart gives the ratio of the amounts of imports by a Company to the amount of exports from that Company over the period from 2011 to 2017. Answer the following questions based on following Line graph. Ratio of value of imports to export What was the percentage increase in imports from 2013 to 2014?
question_answer24) The following Line chart gives the ratio of the amounts of imports by a Company to the amount of exports from that Company over the period from 2011 to 2017. Answer the following questions based on following Line graph. Ratio of value of imports to export If the imports in 2014 was Rs. 250 Crores and the total exports in years 2014 and 2015 together was Rs 500 Crores, then the imports in 2015 was
Please Wait you are being redirected....
You need to login to perform this action.You will be redirected in 3 sec
OTP has been sent to your mobile number and is valid for one hour
Your mobile number is verified.