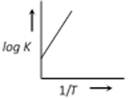
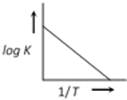
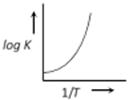
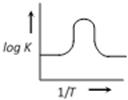
JEE Main & Advanced Chemistry Chemical Kinetics / रासायनिक बलगतिकी Question Bank Collision theory, Energy of activation and Arrhenius equation

  • question_answer
    A graph plotted between log K vs 1/T for calculating activation energy is shown by           [MP PET 2002]

    A)                

    B)                

    C)                     

    D)                

    Correct Answer: B

    Solution :

               A graph plotted between \[\log k\,\,\text{Vs}\,\frac{1}{T}\] for calculating activation energy is shown as                    from Arrhenius equation                    \[\log \,\,k=\log \,\,A-\frac{{{E}_{A}}}{2.303\,\,RT}\]   


You need to login to perform this action.
You will be redirected in 3 sec spinner