Directions : Study the following graph and answer the questions. [SSC CGL Tier II, 2015] The following graph shows production (in thousands) of two type (P and Q) of vehicles by a factory over the years 2009 to 2014. 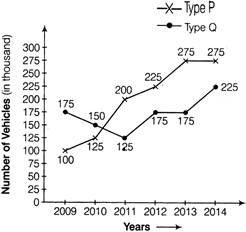 |
A) 48 : 41
B) 5 : 8
C) 41 : 48
D) 8 : 5
Correct Answer: A
Solution :
| [a] Required ratio \[=(100+125+200+225+275+275)\times 1000\] \[(175+150+125+175+175+225)\] \[\times 1000\] \[=1200:1025=48:41\] |


You need to login to perform this action.
You will be redirected in
3 sec

