Directions : Study the following graph and answer the questions. [SSC CGL Tier II, 2015] The following graph shows production (in thousands) of two type (P and Q) of vehicles by a factory over the years 2009 to 2014. 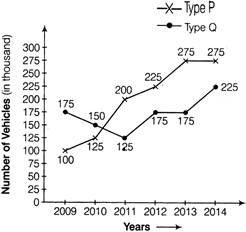 |
A) 3
B) 2
C) 4
D) 5
Correct Answer: A
Solution :
| [a] Average production of Type P vehicles \[=\frac{100+125+200+225+275+275}{6}\] \[=\frac{1200}{6}=200\](in thousand) It' is clear that production of Type P vehicles in three year (2012, 2013 and 2014) was more than the average production of this type vehicles. |


You need to login to perform this action.
You will be redirected in
3 sec

