Directions: A watch company produces four different products. The sale of these products in lakhs during 2005 and 2010 are shown in the following bar diagram. Study the graph and answer the questions. [SSC CGL Tier II, 2014] 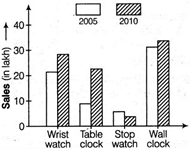 |
A) wrist watch
B) table clock
C) stop watch
D) wall clock
Correct Answer: D
Solution :
| [d] Rate of increase in sales of wrist watch \[=\frac{28.7-21.3}{21.3}\times 100=\frac{7.4}{21.3}\times 100=34.74%\] Rate of increase in sales of table clock \[=\frac{22.3-9.5}{9.5}\times 100\] \[=\frac{12.8}{9.5}\times 100=134.73%\] Rate of increase in sales of Wall clock \[=\frac{32.7-30.7}{30.7}\times 100\] \[=\frac{2\times 100}{30.7}=6.514%\] Note There is no Increase in sales of stop watches. \[\therefore \]The minimum increase in sale in wall clocks. |


You need to login to perform this action.
You will be redirected in
3 sec

