Directions: The bar graph provided below represents the production of Rice and Wheat in different states of a country in the certain year. Answer questions based on the bar graph. 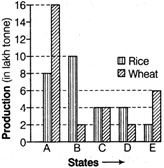 |
A) 15 : 16
B) 12 : 13
C) 13 : 14
D) 14 : 15
Correct Answer: D
Solution :
| [d] Total production of Rice in all the mentioned states \[=(8+10+4+4+2)\] lakh tonne =28 lakh tonne Total production of wheat in all the mentioned states\[=(16+2+4+2+6)\] lakh tonne = 30 lakh tonne \[\therefore \]Required ratio\[=28:30=14:15\] |


You need to login to perform this action.
You will be redirected in
3 sec

