Directions: The pie-chart provided below gives the distribution of land (in a village) under various food crops. Study the pie-chart carefully and answer the questions. 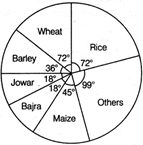 |
A) Wheat, Rice and Maize
B) Wheat, Rice and Jowar
C) Wheat, Rice and Bajra
D) Rice, Barley and Maize
Correct Answer: A
Solution :
| [a] Angle covered by Wheat, Rice and Maize \[=72{}^\circ +72{}^\circ +45{}^\circ =189{}^\circ \] Which is greater than \[180{}^\circ .\] Hence, area covered by these three crops is more than 50% of the total area. |


You need to login to perform this action.
You will be redirected in
3 sec

